


 |
市場調查報告書
商品編碼
1683960
北美室內 LED 照明:市場佔有率分析、行業趨勢和統計、成長預測(2025-2030 年)North America Indoor LED Lighting - Market Share Analysis, Industry Trends & Statistics, Growth Forecasts (2025 - 2030) |
||||||
※ 本網頁內容可能與最新版本有所差異。詳細情況請與我們聯繫。
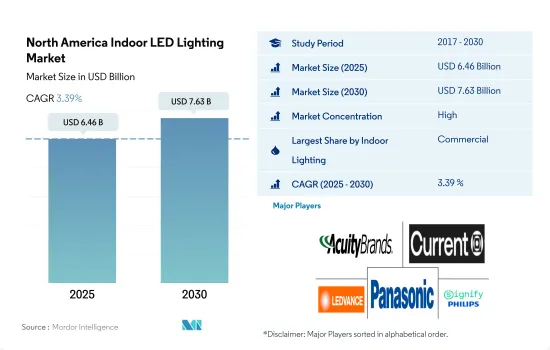
北美室內 LED 照明市場規模預計在 2025 年為 64.6 億美元,預計到 2030 年將達到 76.3 億美元,預測期內(2025-2030 年)的複合年成長率為 3.39%。
工業生產需求的不斷成長、儲存空間需求的不斷成長以及辦公空間可用性的不斷增加正在推動市場需求。
- 從以金額為準來看,商業將在 2023 年佔據大部分市場佔有率,其次是住宅、工業和倉儲 (I&W) 和農業。 I&W 的市場佔有率預計今年將會增加,而其餘部分的市佔率預計將略有下降。美國工業面臨國內外多重阻力,包括國內消費低迷、半導體市場低迷、工廠關閉以及新冠疫情激增導致的供應鏈中斷。此外,美國2021年工業產值維持不變。 2021年美國工業產值2,4971億美元,較2020年成長11.55%。
- 2023 年 5 月,美國工業生產年增 0.2%,此前 2023 年 4 月該數據上修為成長 0.4%。採礦業成長 5%,公共產業下降 3.8%,製造業下降 0.3%。墨西哥的製造業產出總合2,307 億美元,較 2020 年成長 21.44%。因此,該地區工業產量的成長預計將在未來幾年增加對室內照明的需求。
- 從 2022 年中期開始,加拿大商業房地產產業將面臨加劇的市場波動。金融、科技和生命科學產業正在推動辦公室需求,租賃率與 2021 年相比有所上升。建築、倉儲和其他行業的就業人數增加。 2022年12月,加拿大增加了104,000個工作機會。 2022年第四季國內辦公室空置率為16.5%,高於2022年第三季及2021年第四季。基於這些案例,預計在不久的將來對辦公空間的需求將會增加,從而導致對室內照明產品的需求增加。
預計製造工廠、住宅和零售店數量的增加將推動室內照明的需求
- 從金額和數量來看,到 2023 年美國將佔據最大佔有率,其次是北美。預計未來幾年北美其他地區的市場佔有率將會下降,而美國的市佔率波動性將保持在較低水準。許多北美國家對電動車的需求激增,導致生產能力增加。 2022年3月,越南汽車製造商VinFast計劃投資40億美元在查塔姆縣建立全電動SUV工廠。 2023年4月,福特宣布將投資13億美元在加拿大建立新的製造地。製造設施的增加預計將推動市場對室內 LED 的需求。
- 2022 年,美國擁有最多以零售為重點的新興企業(15.05%),包括實體店和電子商務營運。餐飲及其他食品相關企業佔新興企業的13.71%。新興企業的崛起預計將進一步推動該地區對室內 LED 的需求。
- 2020 年至 2022 年,美國家庭數量從 1.2845 億增加到 1.312 億。此外,2023 年 5 月通過建築許可批准的私人住宅數量為 1,491,000 套。這比 2023 年 4 月的 1,417,000 增加了 5.2%。 2023年5月私人住宅開工數為163.1萬套。這比 2022 年 5 月的 1,543,000 高出 5.7%。因此,預計住宅和屋主數量的增加將進一步增加該地區對室內 LED 的需求。
北美室內 LED 照明市場趨勢
私人住宅數量增加和政府政策推動 LED 市場
- 在北美,美國和加拿大是收益和人口最多的城市。截至 2023 年 6 月,北美現有人口為 3.755 億。到 2020 年,美國將以 3.31 億人口佔據該地區人口的最大佔有率,其次是加拿大,人口為 3,770 萬人。 82.6% 的人口居住在都市區(2019 年為 3.047 億)。該地區的人口成長率為0.6%。因此,預計人口的成長將導致LED使用量的增加和家庭照明需求的增加。
- 在加拿大和美國,人們的可支配收入更高,這反過來又賦予了人們更強的消費能力,使他們能夠為新的生活空間分配更多的資金。 2023年3月加拿大的平均月薪為3,464美元,低於2023年2月的3,500美元。雖然平均月收入略有下降,但作為北美已開發國家,購買力相對於其他國家來說較高。
- 2023年5月,頒發建築許可證數量為1,491,000份。這比 2023 年 4 月的 1,417,000 增加了 5.2%。 5月份私人住宅開工數為163.1萬套。這比 2022 年 5 月售出的 1,543,000 台高出 5.7%,比 4 月修訂後的 1,340,000 台高出 21.7%。
- 新法規將最高稅收抵免額從《能源政策法》(EPAct)第 179D 條規定的 2022 年每平方英尺 1.88 美元提高到扣除額升級空間每平方英尺 5 美元(儘管最終將升至每平方英尺 2 美元)。目標計劃包括室內照明、空調和建築外部。預計這些案例將推動該地區對 LED 照明的需求激增。
升級和更換舊燈,並增加政府推廣使用 LED 照明的舉措
- 住宅、商業和工業用途的電力各佔總用電量的約三分之一。 2021 年 3 月,加拿大住宅平均銷售價格與去年同期相比上漲了 31.6%。由於歷史低利率和對空間的需求,疫情期間對較小地區獨戶房屋住宅的需求增加。然而,低房屋抵押貸款利率和快速的人口成長正在推動對住宅的高需求。 2021 年 3 月住宅建築投資連續 11 個月增加,成長 7.6% 至 140 億加元(109.9 億美元)。由於建設活動的增加,該地區的 LED 市場正在擴大。
- 商業部門的電力需求往往在8至10小時左右。工業部門的用電量在一天和一年中往往更加穩定。住宅用電需求在7-9小時左右波動。隨著美國各地建造越來越多的道路和高速公路,對照明的需求也日益增加。在美國,建造公共高速公路和街道的成本在 2017 年平均每月為 894 億美元,到 2021 年將達到每月 999 億美元。因此,各社區正在花費更多資金升級和更換老化的街道照明基礎設施,並鼓勵使用 LED。
- 加拿大政府已啟動多項計劃以減少照明能源消耗,例如加拿大能源之星 (ENERGY STAR Canada)。此外,2021年3月,加拿大拉瓦爾市核准了一項計劃,將37,000盞燈升級為智慧控制LED燈具。改用 LED 照明預計每年可節省 275 萬美元。這些努力將促進該地區LED的普及。
北美室內 LED 照明產業概況
北美室內LED照明市場格局比較集中,前五大廠商的市佔率合計達到75.28%。該市場的主要企業是:ACUITY BRANDS, INC.、Current Lighting Solutions, LLC.、LEDVANCE GmbH (MLS)、松下控股公司和 Signify (飛利浦)(按字母順序排列)。
其他福利
- Excel 格式的市場預測 (ME) 表
- 3 個月的分析師支持
目錄
第 1 章執行摘要和主要發現
第2章 報告要約
第 3 章 簡介
- 研究假設和市場定義
- 研究範圍
- 調查方法
第4章 產業主要趨勢
- 人口
- 人均收入
- LED進口總量
- 照明電力消耗量
- 家庭數量
- LED滲透率
- 園藝區
- 法律規範
- 美國
- 價值鏈與通路分析
第5章 市場區隔
- 室內照明
- 農業照明
- 商業照明
- 辦公室
- 零售
- 其他
- 工業/倉庫
- 住宅
- 國家
- 美國
- 北美其他地區
第6章 競爭格局
- 主要策略趨勢
- 市場佔有率分析
- 業務狀況
- 公司簡介(包括全球概況、市場層級概況、主要業務部門、財務狀況、員工人數、關鍵資訊、市場排名、市場佔有率、產品和服務、最新發展分析)
- ACUITY BRANDS, INC.
- Cree LED(SMART Global Holdings, Inc.)
- Current Lighting Solutions, LLC.
- Dialight
- EGLO Leuchten GmbH
- Feit Electric Company, Inc.
- LEDVANCE GmbH(MLS Co Ltd)
- NVC INTERNATIONAL HOLDINGS LIMITED
- Panasonic Holdings Corporation
- Signify(Philips)
第7章:執行長的關鍵策略問題
第 8 章 附錄
- 世界概況
- 概述
- 五力分析框架
- 全球價值鏈分析
- 市場動態(DRO)
- 資訊來源和進一步閱讀
- 圖片列表
- 關鍵見解
- 資料包
- 詞彙表
The North America Indoor LED Lighting Market size is estimated at 6.46 billion USD in 2025, and is expected to reach 7.63 billion USD by 2030, growing at a CAGR of 3.39% during the forecast period (2025-2030).
Increasing demand for industrial production, rising need for storage space, and increasing availability of office space are driving the demand for the market
- In terms of value, in 2023, commercial accounted for the majority of the share, followed by residential, industrial and warehouse (I&W), and agricultural. The market share is expected to gain in I&W and a small reduction in the remaining divisions in years. The US industries faced several internal and external headwinds, such as weak domestic consumption, semiconductor crunch, plant closures, and supply chain disruptions caused by the surge of COVID-19. Further, the United States sustained its industrial production in 2021. In 2021, the United States produced a total of USD 2,497.1 billion, an increase of 11.55% compared to 2020.
- In the United States, industrial production grew by 0.2% Y-o-Y in May 2023, after an upwardly revised rise of 0.4% in April 2023. Mining went up by 5%, utilities dropped by 3.8%, and manufacturing fell by 0.3%. Mexico produced a total of USD 230.07 billion, an increase of manufacturing output of 21.44% compared to 2020. Thus, the growing industrial production in this region is expected to create more demand for Indoor lighting in the coming years.
- The Canadian commercial real estate sector has been facing increasing market volatility since the middle of 2022. The financial, technology, and life sciences sectors are the drivers of demand for office space, with leasing rates increasing compared to 2021. Employment gains were registered in the construction, warehouse, and other sectors. In December 2022, 104 thousand jobs were added in Canada. The availability of national offices in Q4 of 2022 and accounted for 16.5%, which was higher than in Q3 of 2022 and Q4 of 2021. These instances are expected to create more demand for office spaces in the near future, which will result in creating more need for indoor lighting products.
The growing number of manufacturing facilities, house owners, and retail facilities is expected to drive the demand for indoor lighting
- In terms of value and volume, in 2023, the United States accounted for the majority of the share, followed by the Rest of North America. The market share is expected to decline for the Rest of North America and gain for the United States with less fluctuation in the coming years. Demand for EVs surged across many countries in North America, resulting in increasing manufacturing facilities. In March 2022, VinFast, a Vietnamese automaker, planned to establish an all-electric SUV plant in Chatham County with an investment of USD 4 billion. In April 2023, Ford announced its new manufacturing hub in Canada, with an investment of USD 1.3 billion. The increase in manufacturing facilities is expected to create more demand for indoor LEDs in the market.
- In 2022, the largest number of startups in the United States focused on retail (15.05%), including brick-and-mortar stores and an e-commerce business. Restaurants and other food-related businesses account for 13.71% of the startups. The increasing number of startups is expected to create more need for indoor LEDs in the region.
- The number of households in the United States grew from 128.45 million to 131.2 million between 2020 and 2022. Further, the number of privately owned dwelling units authorized by building permits in May 2023 was 1,491,000. This is 5.2% more than the April 2023 rate, which was increased from 1,417,000. The number of privately owned homes started in May 2023 was 1,631,000. This is 5.7% above the May 2022 rate of 1,543,000. Thus, the growing number of households and house owners is expected to create more demand for indoor LEDs in the region.
North America Indoor LED Lighting Market Trends
Increase in private-owned dwellings and government policy to drive the market for LED
- In North America, the US and Canada are the main cities in terms of revenue and population. The current population of Northern America is 375.5 million as of June 2023. The United States occupies a major share of the people in this region, accounting for 331 million, followed by Canada at 37.7 million by 2020. 82.6 % of the population lives in urban areas (304.7 million people in 2019). The population in this region is growing with a 0.6% change. Thus, the increase in population is expected to create more LED penetration and increase the need for illumination in the country.
- In Canada and the US, disposable income is high, resulting in rising spending power of individuals and affording more money on new residential spaces. Canada's monthly earnings stood at USD 3,464 in Mar 2023, reduced from USD 3,500 in Feb 2023. Even though it is showing a slight decline in average monthly earnings, it has a high purchasing value compared to other nations, as it is a developed country in North America.
- The number of privately owned dwelling units authorized by building permits in May 2023 was 1,491,000. This is 5.2% more than the April 2023 rate, which was increased from 1,417,000. The number of privately owned homes started in May was 1,631,000. This is 5.7% above the May 2022 rate of 1,543,000 and is 21.7% higher than the revised April estimate of 1,340,000.
- As per the Energy Policy Act (EPAct) section 179D, the maximum tax deduction jumped to USD 5 per sq. ft. of upgraded space in 2023 under the new regulations, which has USD 1.88 per sq. ft. deductions in 2022 (but is set to rise to USD 2.00 per sq. ft.). Eligible projects include interior lighting, HVAC, and building envelopes. Such instances are expected to surge the demand for LED lighting in the region.
Upgradation and replacement of old lamps, increasing government initiatives to promote the use of LED lights
- Each customer type-residential, commercial, and industrial-uses around one-third of the total amount of electricity. The average selling price of a home in Canada climbed by 31.6% Y-o-Y in March 2021. Demand for detached homes in smaller areas increased during the pandemic due to historically low lending rates and a need for more space. However, low mortgage rates and rapid population increase drive a high demand for new homes. Residential building investment increased for 11 consecutive months in March 2021, up 7.6% to CAD 14.0 billion (USD 10.99 billion). The region's LED market is expanding due to the rise in construction activities.
- Electricity demand in the commercial sector tends to be around 8-10 hours. Electricity use in the industrial sector tends not to fluctuate through the day or year. Electricity demand in the residential sector varies for about 7 to 9 hours. The demand for illumination is also rising as there are more roads and highways across the US. In the US, public highway and street building cost an average of USD 89.4 billion per month on average in 2017 and USD 99.9 billion per month on average in 2021. As a result, communities are spending more money to upgrade or replace their old street lighting infrastructure, encouraging the use of LEDs.
- The Canadian government has launched several programs to cut down on the amount of energy used for lighting, including ENERGY STAR in Canada. Furthermore, in March 2021, the Canadian city of Laval approved a plan to upgrade 37,000 lamps to LED luminaires with smart controls. The switch to LED lighting is anticipated to save USD 2.75 million annually. The adoption of LEDs in the area is facilitated by these efforts.
North America Indoor LED Lighting Industry Overview
The North America Indoor LED Lighting Market is fairly consolidated, with the top five companies occupying 75.28%. The major players in this market are ACUITY BRANDS, INC., Current Lighting Solutions, LLC., LEDVANCE GmbH (MLS Co Ltd), Panasonic Holdings Corporation and Signify (Philips) (sorted alphabetically).
Additional Benefits:
- The market estimate (ME) sheet in Excel format
- 3 months of analyst support
TABLE OF CONTENTS
1 EXECUTIVE SUMMARY & KEY FINDINGS
2 REPORT OFFERS
3 INTRODUCTION
- 3.1 Study Assumptions & Market Definition
- 3.2 Scope of the Study
- 3.3 Research Methodology
4 KEY INDUSTRY TRENDS
- 4.1 Population
- 4.2 Per Capita Income
- 4.3 Total Import Of Leds
- 4.4 Lighting Electricity Consumption
- 4.5 # Of Households
- 4.6 Led Penetration
- 4.7 Horticulture Area
- 4.8 Regulatory Framework
- 4.8.1 United States
- 4.9 Value Chain & Distribution Channel Analysis
5 MARKET SEGMENTATION (includes market size in Value in USD and Volume, Forecasts up to 2030 and analysis of growth prospects)
- 5.1 Indoor Lighting
- 5.1.1 Agricultural Lighting
- 5.1.2 Commercial
- 5.1.2.1 Office
- 5.1.2.2 Retail
- 5.1.2.3 Others
- 5.1.3 Industrial and Warehouse
- 5.1.4 Residential
- 5.2 Country
- 5.2.1 United States
- 5.2.2 Rest of North America
6 COMPETITIVE LANDSCAPE
- 6.1 Key Strategic Moves
- 6.2 Market Share Analysis
- 6.3 Company Landscape
- 6.4 Company Profiles (includes Global level Overview, Market level overview, Core Business Segments, Financials, Headcount, Key Information, Market Rank, Market Share, Products and Services, and analysis of Recent Developments)
- 6.4.1 ACUITY BRANDS, INC.
- 6.4.2 Cree LED (SMART Global Holdings, Inc.)
- 6.4.3 Current Lighting Solutions, LLC.
- 6.4.4 Dialight
- 6.4.5 EGLO Leuchten GmbH
- 6.4.6 Feit Electric Company, Inc.
- 6.4.7 LEDVANCE GmbH (MLS Co Ltd)
- 6.4.8 NVC INTERNATIONAL HOLDINGS LIMITED
- 6.4.9 Panasonic Holdings Corporation
- 6.4.10 Signify (Philips)
7 KEY STRATEGIC QUESTIONS FOR LED CEOS
8 APPENDIX
- 8.1 Global Overview
- 8.1.1 Overview
- 8.1.2 Porter's Five Forces Framework
- 8.1.3 Global Value Chain Analysis
- 8.1.4 Market Dynamics (DROs)
- 8.2 Sources & References
- 8.3 List of Tables & Figures
- 8.4 Primary Insights
- 8.5 Data Pack
- 8.6 Glossary of Terms
 中國LED照明:市場佔有率分析、產業趨勢與統計、成長預測(2025-2030年)中國室內 LED 照明:市場佔有率分析、產業趨勢與統計、成長預測(2025-2030 年)中東和非洲室內 LED 照明:市場佔有率分析、行業趨勢和統計、成長預測(2025-2030 年)亞太室內 LED 照明:市場佔有率分析、產業趨勢與統計、成長預測(2025-2030 年)北美 LED 照明:市場佔有率分析、行業趨勢和成長預測(2025-2030 年)南美LED照明:市場佔有率分析、產業趨勢與成長預測(2025-2030年)南美室內 LED 照明:市場佔有率分析、行業趨勢和統計、成長預測(2025-2030 年)印度室內 LED 照明:市場佔有率分析、行業趨勢和統計、成長預測(2025-2030 年)室內 LED 照明:市場佔有率分析、行業趨勢和統計、成長預測(2025-2030 年)德國LED照明:市場佔有率分析、產業趨勢與成長預測(2025-2030年)