


 |
市場調查報告書
商品編碼
1683936
中國LED照明:市場佔有率分析、產業趨勢與統計、成長預測(2025-2030年)China LED Lighting - Market Share Analysis, Industry Trends & Statistics, Growth Forecasts (2025 - 2030) |
||||||
價格
※ 本網頁內容可能與最新版本有所差異。詳細情況請與我們聯繫。
簡介目錄
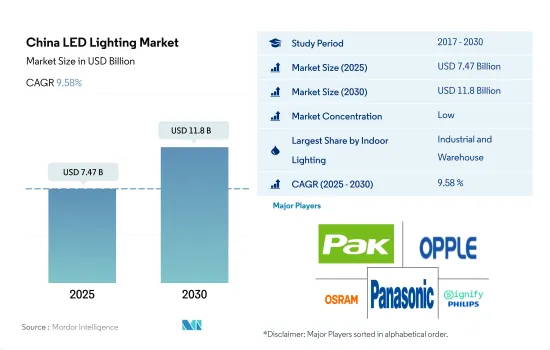
預計2025年中國LED照明市場規模為74.7億美元,到2030年將達到118億美元,預測期間(2025-2030年)的複合年成長率為9.58%。
新創公司數量的增加、製造設施數量的增加以及零售的成長預計將推動室內照明的需求。
- 到 2023 年,工業和倉儲(I&W)將佔據大部分佔有率(79.6%),其次是商業、農業和住宅。預計未來幾年所有應用領域的市場佔有率將略有下降,而工業和水務領域的市場佔有率將增加。中國工業面臨多重內部和外部阻力,包括國內消費低迷、景氣下降、以及新冠肺炎病例激增導致的供應鏈中斷。此外,中國在 2021 年維持了工業生產。 2021 年,中國總產出為 4,8,658 億美元,比 2020 年成長 26.04%。因此,工業產量的增加將在未來幾年創造對室內照明的需求。
- 由於全球汽車市場依賴中國提供廉價的零件和整車供應商,中國各地對汽車製造廠和倉庫的需求正在成長。鑑於這些案例,預計研究期間室內 LED 的需求將會上升。 BMW在瀋陽開設了新工廠,奧迪在長春的新電動車工廠也開始生產。
- 中國零售業持續呈現強勁成長跡象,2023年5月零售業與前一年同期比較增12.7%。預計網路購物激增將推動該地區對新倉庫的進一步需求,進而推動對室內照明的需求。
- 中國是全球最大的數十億美元新興企業生產國之一。 2022年,中國產生了74家新的獨角獸企業,落後美國。約70%的新獨角獸來自醫療保健和智慧物流領域,帶動商業空間需求激增。根據上述案例,預計明年室內LED的需求將會增加。
中國LED照明市場趨勢
穩定的出生率與住宅、小型企業和電動車的正成長相輔相成
- 2022年,中國總人口為14.1175億人。 2022年,中國每1,000名成年人出生6.77名嬰兒。隨著年輕人口的穩定成長,2021年中國每年新建商業地產面積約1.4105億平方公尺,2022年3月工工業部將再支持孵化3,000家小巨人企業。到2025年,中國要打造1,000家單項產品冠軍企業和10,000家小巨人企業。商業和企業的成長推動了對更多 LED 的需求。
- 在中國社會經濟底層,截至2019年,超過60%的居民擁有自己的房屋。與大城市的居民相比,擁有率相當高。在二、三線城市和城鎮,41%的屋主沒有房屋抵押貸款。 2019年農村和都市區平均家庭戶面積分別為48.9平方公尺和39.8平方公尺。 LED 使用量的增加可能受到住宅購買量增加的影響。
- 由於人口成長,截至2021年9月,中國的汽車持有為2.97億輛。 2021年第三季機動車註冊量為883萬輛。 2021年,超過85%的電動車銷量發生在中國。 2021年,中國電動車銷量比全球其他地區(300萬輛)多330萬輛。到 2021 年,中國的電動車持有將達到 780 萬輛,仍將是全球最大電動車保有量國家。隨著電動車數量的不斷成長,中國 LED 照明市場也將隨之成長,帶動對 LED 的需求增加。
人均所得成長補充家庭成長
- 2017年,中國平均家庭規模為3.03人。到2021年,這一數字將下降到2.7人,這意味著獨棟住宅/住宅的數量將會增加。自1998年以來,現有公共住宅被私有化,大量供給以自有住宅為主的私人住房,使中國從一個公住宅佔多數的國家轉變為住房自有率最高的國家。到2020年,中國90%以上的家庭將擁有住宅(都市區為87%,農村為96%)。與許多富裕國家相比,超過20%的中國家庭擁有多處房產。因此,房地產數量的增加預計將推動該國採用LED滿足照明需求。
- 中國的可支配收入正在增加,這反過來又增強了個人的消費能力,讓他們有更多錢來購買新的居住空間。 2022年12月,中國的人均收入達到12,732.5美元,而2021年12月為12,615.7美元。截至2022年3月,印度的人均所得為2,301.4美元,低於中國。
- 據報道,2019年中國農村人均住宅占地面積為48,900平方米,高於前一年的47,300平方米。在都市區,由於對小型公寓/單間公寓的投資增加,公寓的平均面積從 2019 年的 39,800 平方米下降到 2020 年的 38,600 平方米。這推動了該國LED照明的發展。例如,中國人正在中國較小的城市投資廉價公寓。 2012年,中國家庭獲得了22億元人民幣(3.1億美元)的節能燈泡和LED燈使用計畫。預計這種案例將增加該國對 LED 照明的需求。
中國LED照明產業概況
中國LED照明市場較為分散,前五大企業市佔率合計為26.92%。該市場的主要企業有:廣東百強企業、歐普照明、歐司朗有限公司、松下控股公司和 Signify(飛利浦)(按字母順序排列)。
其他福利
- Excel 格式的市場預測 (ME) 表
- 3 個月的分析師支持
目錄
第 1 章執行摘要和主要發現
第2章 報告要約
第3章 引言
- 研究假設和市場定義
- 研究範圍
- 調查方法
第4章 產業主要趨勢
- 汽車產量
- 人口
- 人均收入
- 汽車貸款利率
- 充電站數量
- 持有汽車數量
- LED進口總量
- 照明功耗
- #家庭數量
- 道路網路
- LED滲透率
- #體育場數量
- 園藝區
- 法律規範
- 室內照明
- 中國
- 戶外照明
- 中國
- 汽車照明
- 中國
- 室內照明
- 價值鍊和通路分析
第5章 市場區隔
- 室內照明
- 農業照明
- 商業照明
- 辦公室
- 零售
- 其他
- 工業/倉庫
- 住宅照明
- 戶外照明
- 公共設施
- 路
- 其他
- 汽車實用照明
- 日間行車燈 (DRL)
- 方向指示器
- 頭燈
- 倒車燈
- 紅綠燈
- 尾燈
- 其他
- 汽車照明
- 二輪車
- 商用車
- 搭乘用車
第6章 競爭格局
- 關鍵策略趨勢
- 市場佔有率分析
- 業務狀況
- 公司簡介(包括全球概況、市場層級概況、主要業務部門、財務狀況、員工人數、關鍵資訊、市場排名、市場佔有率、產品和服務、最新發展分析)
- ACUITY BRANDS, INC.
- Guangdong PAK Corporation Co.,Ltd.
- HELLA GmbH & Co. KGaA(FORVIA)
- KOITO MANUFACTURING CO., LTD.
- OPPLE Lighting Co., Ltd
- OSRAM GmbH.
- Panasonic Holdings Corporation
- Signify(Philips)
- Stanley Electric Co., Ltd.
- Valeo
第7章:執行長的關鍵策略問題
第 8 章 附錄
- 世界概況
- 概述
- 五力分析框架
- 全球價值鏈分析
- 市場動態(DRO)
- 資訊來源及延伸閱讀
- 圖片列表
- 關鍵見解
- 資料包
- 詞彙表
簡介目錄
Product Code: 50001634
The China LED Lighting Market size is estimated at 7.47 billion USD in 2025, and is expected to reach 11.8 billion USD by 2030, growing at a CAGR of 9.58% during the forecast period (2025-2030).
Growing star-ups, rising manufacturing facilities, and increasing retail sales are expected to raise the demand for indoor lighting
- In 2023, industrial and warehouse (I&W) accounted for the majority of the share (79.6%), followed by commercial, agricultural, and residential. The market share is expected to have a minimal reduction in all applications and a gain in (I&W) in the coming years. Chinese industries faced several internal and external headwinds, such as weak domestic consumption, declining business confidence, and supply chain disruptions caused by the surge of COVID-19. Further, China sustained its industrial production in 2021. In 2021, China produced a total of USD 4865.8 billion, an increase of 26.04% compared to 2020. Thus, the growing industrial production will create demand for Indoor lighting in the coming years.
- The demand for automotive manufacturing plants and warehouses across China is rising, and this is due to the global auto market relying on China because of its cheap components, source of finished cars, and others. Such instances necessitate more requirements for Indoor LEDs during the study period. BMW opened a new factory in the city of Shenyang, and Audi started production at a new EV factory in the city of Changchun.
- China's retail sector continues to show signs of robust growth, with retail sales surging by 12.7% in May 2023 from a year earlier. The rapid increase in online shoppers is further expected to boost the need for new warehouses in the region, resulting in more demand for indoor lighting.
- China is one of the top players in creating billion-dollar start-ups. In 2022, China added 74 new unicorns, falling behind the United States. Around 70% of its new unicorns come from the healthcare and smart logistics sectors, which surges the demand for commercial spaces. The above instances are expected to drive the demand for Indoor LEDs in the coming year.
China LED Lighting Market Trends
A steady birth rate is complementing the positive growth of homeowners, small and medium-sized businesses, and electric vehicles
- In 2022, China had a total population of 1,411.75 million. In China, 6.77 children were born for every 1,000 adults in 2022. With the steady growth of the youth, around 141.05 million sq. m of commercial real estate was being built each year in China in 2021. The incubation of an additional 3,000 small giant enterprises in the year was supported by the Ministry of Industry and Information Technology in March 2022. By 2025, China wants to have 1,000 single-product champion enterprises and 10,000 tiny giant businesses. The demand to use more LEDs will be driven by the growth in businesses and enterprises.
- In China's lower socioeconomic strata, as of 2019, more than 60% of residents were homeowners. In comparison to citizens of big cities, the ownership rate was substantially greater. In lower-tier cities and towns, 41% of homeowners did not have a mortgage on their home. In 2019, the average household size in rural and urban areas was 48.9 sq. m and 39.8 sq. m, respectively. The increased use of LEDs may be influenced by the rise in home purchases.
- Owing to the growing population, China had 297 million cars as of September 2021. Motor vehicle registrations totaled 8.83 million in the third quarter of 2021. In 2021, more than 85% of all electric vehicle sales took place in China. In 2021, China sold 3.3 million more electric vehicles than the rest of the world (3.0 million). With 7.8 million vehicles, China's electric car fleet continued to be the largest in the world in 2021. The requirement for additional LEDs will be facilitated by the rise in the LED lighting market in China due to the rise in the number of EVs.
The rising per capita income complements the growth of households
- The average household size in China registered 3.03 persons in 2017. By 2021, it reduced to 2.7, indicating an increase in private households/housing ownerships. After 1998, China went from being a nation dominated by public renters to one with the highest homeownership rates, owing to the privatization of existing public housing and the vast provision of private housing, primarily in the ownership sector. By 2020, more than 90% of households in China owned their homes (87% in urban areas and 96% in rural areas). In contrast to many affluent countries, more than 20% of Chinese households own several properties. Thus, the increase in the number of properties is expected to create more LED penetration for the need for illumination in the country.
- In China, disposable income is growing, resulting in the rising spending power of individuals who spend more money on new residential spaces. China's per capita income reached USD 12,732.5 in December 2022 compared to USD 12,615.7 in December 2021. India's per capita income was USD 2,301.4 as of Mar 2022, which is lower than China's.
- In China, the floor area of residential buildings per capita for rural areas was reported at 48.900 sq. m in 2019, an increase from the previous year of 47.300 sq. m. In urban areas, it was 38.600 sq. m in 2020, a decrease from 39.800 sq. m in 2019 due to an increase in the investment in small-size apartments/studio apartments. This is propelling the growth of LED lighting in the country. For instance, people in China invested in low-cost apartments in small Chinese cities. In 2012, households in China were offered a program of CNY 2.2 billion (USD 0.31 billion) for the use of energy-conserving light bulbs and LEDs. Such instances are expected to increase the demand for LED lighting in the country.
China LED Lighting Industry Overview
The China LED Lighting Market is fragmented, with the top five companies occupying 26.92%. The major players in this market are Guangdong PAK Corporation Co.,Ltd., OPPLE Lighting Co., Ltd, OSRAM GmbH., Panasonic Holdings Corporation and Signify (Philips) (sorted alphabetically).
Additional Benefits:
- The market estimate (ME) sheet in Excel format
- 3 months of analyst support
TABLE OF CONTENTS
1 EXECUTIVE SUMMARY & KEY FINDINGS
2 REPORT OFFERS
3 INTRODUCTION
- 3.1 Study Assumptions & Market Definition
- 3.2 Scope of the Study
- 3.3 Research Methodology
4 KEY INDUSTRY TRENDS
- 4.1 Automotive Production
- 4.2 Population
- 4.3 Per Capita Income
- 4.4 Interest Rate For Auto Loans
- 4.5 Number Of Charging Stations
- 4.6 Number Of Automobile On-road
- 4.7 Total Import Of Leds
- 4.8 Lighting Electricity Consumption
- 4.9 # Of Households
- 4.10 Road Networks
- 4.11 Led Penetration
- 4.12 # Of Stadiums
- 4.13 Horticulture Area
- 4.14 Regulatory Framework
- 4.14.1 Indoor Lighting
- 4.14.1.1 China
- 4.14.2 Outdoor Lighting
- 4.14.2.1 China
- 4.14.3 Automotive Lighting
- 4.14.3.1 China
- 4.14.1 Indoor Lighting
- 4.15 Value Chain & Distribution Channel Analysis
5 MARKET SEGMENTATION (includes market size in Value in USD and Volume, Forecasts up to 2030 and analysis of growth prospects)
- 5.1 Indoor Lighting
- 5.1.1 Agricultural Lighting
- 5.1.2 Commercial
- 5.1.2.1 Office
- 5.1.2.2 Retail
- 5.1.2.3 Others
- 5.1.3 Industrial and Warehouse
- 5.1.4 Residential
- 5.2 Outdoor Lighting
- 5.2.1 Public Places
- 5.2.2 Streets and Roadways
- 5.2.3 Others
- 5.3 Automotive Utility Lighting
- 5.3.1 Daytime Running Lights (DRL)
- 5.3.2 Directional Signal Lights
- 5.3.3 Headlights
- 5.3.4 Reverse Light
- 5.3.5 Stop Light
- 5.3.6 Tail Light
- 5.3.7 Others
- 5.4 Automotive Vehicle Lighting
- 5.4.1 2 Wheelers
- 5.4.2 Commercial Vehicles
- 5.4.3 Passenger Cars
6 COMPETITIVE LANDSCAPE
- 6.1 Key Strategic Moves
- 6.2 Market Share Analysis
- 6.3 Company Landscape
- 6.4 Company Profiles (includes Global level Overview, Market level overview, Core Business Segments, Financials, Headcount, Key Information, Market Rank, Market Share, Products and Services, and analysis of Recent Developments)
- 6.4.1 ACUITY BRANDS, INC.
- 6.4.2 Guangdong PAK Corporation Co.,Ltd.
- 6.4.3 HELLA GmbH & Co. KGaA (FORVIA)
- 6.4.4 KOITO MANUFACTURING CO., LTD.
- 6.4.5 OPPLE Lighting Co., Ltd
- 6.4.6 OSRAM GmbH.
- 6.4.7 Panasonic Holdings Corporation
- 6.4.8 Signify (Philips)
- 6.4.9 Stanley Electric Co., Ltd.
- 6.4.10 Valeo
7 KEY STRATEGIC QUESTIONS FOR LED CEOS
8 APPENDIX
- 8.1 Global Overview
- 8.1.1 Overview
- 8.1.2 Porter's Five Forces Framework
- 8.1.3 Global Value Chain Analysis
- 8.1.4 Market Dynamics (DROs)
- 8.2 Sources & References
- 8.3 List of Tables & Figures
- 8.4 Primary Insights
- 8.5 Data Pack
- 8.6 Glossary of Terms
02-2729-4219
+886-2-2729-4219
 中國室內 LED 照明:市場佔有率分析、產業趨勢與統計、成長預測(2025-2030 年)中東和非洲室內 LED 照明:市場佔有率分析、行業趨勢和統計、成長預測(2025-2030 年)亞太室內 LED 照明:市場佔有率分析、產業趨勢與統計、成長預測(2025-2030 年)北美 LED 照明:市場佔有率分析、行業趨勢和成長預測(2025-2030 年)北美室內 LED 照明:市場佔有率分析、行業趨勢和統計、成長預測(2025-2030 年)南美LED照明:市場佔有率分析、產業趨勢與成長預測(2025-2030年)南美室內 LED 照明:市場佔有率分析、行業趨勢和統計、成長預測(2025-2030 年)印度室內 LED 照明:市場佔有率分析、行業趨勢和統計、成長預測(2025-2030 年)室內 LED 照明:市場佔有率分析、行業趨勢和統計、成長預測(2025-2030 年)德國LED照明:市場佔有率分析、產業趨勢與成長預測(2025-2030年)
▼