


 |
市場調查報告書
商品編碼
1687227
除草劑-市場佔有率分析、產業趨勢與統計、成長預測(2025-2030)Herbicide - Market Share Analysis, Industry Trends & Statistics, Growth Forecasts (2025 - 2030) |
||||||
價格
※ 本網頁內容可能與最新版本有所差異。詳細情況請與我們聯繫。
簡介目錄
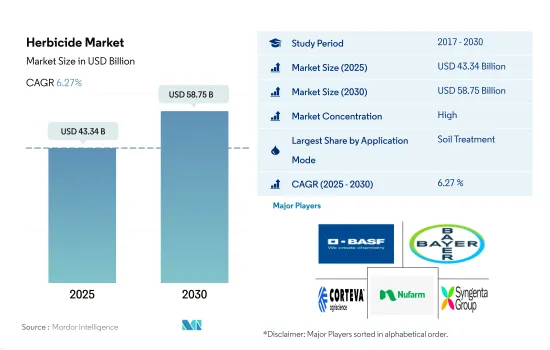
除草劑市場規模預計在 2025 年達到 433.4 億美元,預計到 2030 年將達到 587.5 億美元,預測期內(2025-2030 年)的複合年成長率為 6.27%。
土壤施用除草劑佔據全球除草劑市場主導地位
- 雜草是造成農業系統產量損失和品質下降的主要原因。雜草與作物爭奪光、水和養分等資源。雜草也會作為破壞性植物病原體的宿主,或作為在植物之間傳播病原體的昆蟲媒介,或兩者兼而有之,從而危害作物。使用除草劑是控制雜草最有效的方法,它比其他控制雜草的方法更便宜、更可靠、節省勞力和時間。可以使用幾種除草劑施用技術來控制各種大小的草本雜草、樹木和灌木。
- 土壤施用在全球除草劑市場中佔據主導地位,2022 年佔 48.4% 的市場佔有率。出苗前除草劑可經由土壤處理施用。儘早抑制雜草將有助於作物在生長季節有一個良好的開始。土壤活性除草劑具有不同的活性成分和施用時間,可以幫助解決棘手的抗性雜草並減緩除草劑抗性的產生。
- 2022 年,葉面噴布佔全球除草劑市值的 30.3%。出苗後除草劑也可以透過這種方式施用。為了達到效果,出苗後除草劑必須從葉面轉移到目標部位。葉面噴布方法,其次是化學施用方法,佔 2022 年全球除草劑市場的 19.6%。
- 在農業領域,使用除草劑可以最佳化作物生產力並提高整體盈利。預測期內(2023-2029 年),除草劑使用量的複合年成長率預計達到 5.1%。
雜草導致作物損失增加,預計增加除草劑需求
- 雜草是各種種植制度中生產的主要生物限制因素。雜草造成的作物產量損失取決於幾個因素,包括雜草出現的時間、雜草密度、雜草類型和作物類型。如果不加以控制,雜草可能會導致 100% 的產量損失。除草劑是全球雜草控制的重要組成部分。
- 2022年,南美洲佔全球除草劑市場的35.5%(以金額為準計算)。南美洲除草劑市場正在經歷成長,包括阿根廷、巴西、智利和其他南美國家。由於這些國家是主要的農業生產國,擁有大片農田,因此使用除草劑對於控制雜草數量和確保最佳作物產量至關重要。預計南美除草劑市場在預測期內(2023-2029 年)的複合年成長率將達到 5.2%。
- 2022 年北美佔全球除草劑市場的 31.6%(以金額為準計算)。北美氣候多樣,適合全部區域多種作物。北美洲種植穀物、豆類、水果、蔬菜和觀賞植物。大多數黃金時段的農民都實行單一栽培,即在廣大的土地上種植單一作物作為主要收入來源,導致雜草滋生增加、產量下降。約翰草、稗草、帕爾默莧菜和仙人掌是該地區的主要雜草。
- 預計預測期內(2023-2029 年)全球除草劑市場的複合年成長率將達到 5.1%。農作物損失的增加、保護農作物的需要、對雜草控制的認知的不斷提高以及對農產品的需求的不斷增加正在推動市場的成長。
全球除草劑市場趨勢
雜草適應不同環境和產生抗藥性的能力導致了除草劑使用率的增加。
- 過去一段時期,全球每公頃除草劑的平均消費量增加了44.4%,從2017年的1.8公斤/公頃增加到2022年的2.6公斤/公頃。雜草的適應性強、繁殖速度快,導致與作物的競爭加劇,造成產量損失增加,因此與去年同期相比,增加化學除草劑施用量的需求增加。因此,越來越需要增加除草劑的使用來控制雜草並防止農業生產力損失。
- 與殺菌劑和殺蟲劑相比,除草劑是最常用的化學農藥。在所有地區中,南美洲由於大豆、玉米、甘蔗等作物產量強勁,且商業化種植規模大、種植密度高,2022年每公頃消費量最高,為5.3公斤。集約化耕作方式增加了雜草壓力,因此需要使用除草劑來控制雜草數量並有效保護作物產量。緊接著南美洲的是北美洲和歐洲,2022年每公頃平均消費量分別為1.8公斤和1.7公斤。
- 抗除草劑雜草的增加和蔓延已成為全球農民面臨的嚴重問題,導致除草劑的使用增加以及使用多種除草劑來對抗這些抗性雜草族群。例如,長芒莧和普通水麻對Glyphosate有抗性,馬尾草和大豚草對多種除草劑有抗性,而藜草對乙醯乳酸合成酶抑制除草劑有抗性。
- 由於雜草適應不同環境和產生抗藥性等因素,對除草劑噴灑的需求正在迅速增加。
2,4-D和Glyphosate是世界廣泛用於選擇性控制闊葉雜草的除草劑。
- 甲草胺是一種三嗪類除草劑。價格為每噸16,600美元。它被廣泛用於控制農作物中的多種雜草。甲草胺特異性針對葉綠體中的光系統 II (PSII) 蛋白質複合物,抑制植物在光合作用過程中將光能轉化為化學能的能力。這會導致有毒化合物的積聚,最終殺死目標雜草。
- Atrazine是一種除草劑,廣泛用於控制玉米和水稻作物中的闊葉雜草和禾本科雜草,如稗草、莧菜屬和莧菜。 2022年,該除草劑的價值為13,500美元。印度是世界上最大的莠Atrazine技術進口國,而中國是最大的出口國。
- Paraquat是一種廣泛使用的除草劑,屬於Bipyridylium化合物家族。由於Paraquat起效快且無選擇性,它通常被用作種植前或出苗前除草劑,以在作物出苗前控制雜草。它對棉花、玉米、大豆和甘蔗等多種作物都有效。 2022 年Paraquat的價格為 7,000 美元。
- 二甲戊靈是一種Dinitroanilines除草劑。廣泛用於防治農作物中的多種一年生雜草和闊葉雜草。 2022 年的價格為每噸 3,300 美元。二甲戊靈可抑制雜草早期生長,減少雜草生長早期與作物的競爭。
- 2,4-D和Glyphosate是世界廣泛用於選擇性控制闊葉雜草的除草劑。 2022 年的價格分別為 2,300 美元和 1,100 美元。
除草劑行業概況
除草劑市場格局較為集中,前五大公司佔69.12%的市佔率。市場的主要企業包括BASF公司、拜耳公司、科迪華農業科技、紐發姆有限公司、先正達集團等。
其他福利
- Excel 格式的市場預測 (ME) 表
- 3個月的分析師支持
目錄
第1章執行摘要和主要發現
第2章 報告要約
第3章 引言
- 研究假設和市場定義
- 研究範圍
- 調查方法
第4章 產業主要趨勢
- 每公頃農藥消費量
- 活性成分價格分析
- 法律規範
- 阿根廷
- 澳洲
- 巴西
- 加拿大
- 智利
- 中國
- 法國
- 德國
- 印度
- 印尼
- 義大利
- 日本
- 墨西哥
- 緬甸
- 荷蘭
- 巴基斯坦
- 菲律賓
- 俄羅斯
- 南非
- 西班牙
- 泰國
- 烏克蘭
- 英國
- 美國
- 越南
- 價值鍊和通路分析
第5章市場區隔
- 應用模式
- 化學灌溉
- 葉面噴布
- 燻蒸
- 土壤處理
- 作物類型
- 經濟作物
- 水果和蔬菜
- 糧食
- 豆類和油籽
- 草坪和觀賞植物
- 地區
- 非洲
- 按國家
- 南非
- 其他非洲國家
- 亞太地區
- 按國家
- 澳洲
- 中國
- 印度
- 印尼
- 日本
- 緬甸
- 巴基斯坦
- 菲律賓
- 泰國
- 越南
- 其他亞太地區
- 歐洲
- 按國家
- 法國
- 德國
- 義大利
- 荷蘭
- 俄羅斯
- 西班牙
- 烏克蘭
- 英國
- 其他歐洲國家
- 北美洲
- 按國家
- 加拿大
- 墨西哥
- 美國
- 北美其他地區
- 南美洲
- 按國家
- 阿根廷
- 巴西
- 智利
- 其他南美國家
- 非洲
第6章競爭格局
- 關鍵策略趨勢
- 市場佔有率分析
- 商業狀況
- 公司簡介
- ADAMA Agricultural Solutions Ltd
- BASF SE
- Bayer AG
- Corteva Agriscience
- FMC Corporation
- Jiangsu Yangnong Chemical Co. Ltd
- Nufarm Ltd
- Sumitomo Chemical Co. Ltd
- Syngenta Group
- UPL Limited
第7章:CEO面臨的關鍵策略問題
第 8 章 附錄
- 世界概況
- 概述
- 五力分析框架
- 全球價值鏈分析
- 市場動態(DRO)
- 資訊來源及延伸閱讀
- 圖片列表
- 關鍵見解
- 資料包
- 詞彙表
簡介目錄
Product Code: 56812
The Herbicide Market size is estimated at 43.34 billion USD in 2025, and is expected to reach 58.75 billion USD by 2030, growing at a CAGR of 6.27% during the forecast period (2025-2030).
Soil application dominates the global herbicide market
- Weeds are a major contributor to yield loss and reduced quality in an agricultural system. They compete with the crop for resources like light, water, and nutrients. Weeds can also harm crop plants by acting as reservoirs for destructive plant pathogens, the insect vectors that move these pathogens from plant to plant, or both. The use of herbicides is the most effective weed management tool, as it is cheaper, more reliable, and more labor- and time-saving than other weed control measures. Several herbicide application techniques can be used to control herbaceous weeds, trees, and bushes of various sizes.
- Soil application dominated the global herbicide market, accounting for a market share of 48.4% in 2022. Pre-emergence herbicides can be applied through soil treatment. By reducing weed pressures early on, crops can get off to a strong start during the cropping season. With different active ingredients and application timings, soil-active herbicides can help tackle troublesome resistant weeds and slow down the development of herbicide resistance.
- Foliar application accounted for 30.3% of the global herbicide market value in 2022. Post-emergence herbicides can be applied through this method. A post-emergence herbicide must move from the leaf surface and reach the target site to be effective. Following the foliar method, chemigation accounted for 19.6% of the global herbicide market in 2022.
- In the agricultural sector, herbicide usage optimizes crop productivity and enhances overall profitability. The usage of herbicides is expected to register a CAGR of 5.1% during the forecast period (2023-2029).
Rising crop losses due to the weeds are expected to boost the demand for herbicides
- Weeds are a major biotic constraint to production in different cropping systems. Yield losses in crops due to weeds depend on several factors, such as weed emergence time, weed density, type of weeds, and crop types. Weeds can result in 100% yield loss if left uncontrolled. Herbicides are an integral part of weed control globally.
- In 2022, South America accounted for a market share of 35.5%, by value, of the global herbicide market. The herbicide market in South America is experiencing growth in various countries, including Argentina, Brazil, Chile, and the rest of South American countries. As these countries are major agricultural producers with vast expanses of farmland, the use of herbicides is crucial to manage weed populations and ensure optimal crop yields. The South American herbicide market is projected to record a CAGR of 5.2% during the forecast period (2023-2029).
- North America accounted for 31.6%, by value, of the global herbicide market in 2022. North America's diverse climate allows for the cultivation of a wide range of crop types across the region. North Americans cultivate grains, legumes, fruits, vegetables, and ornamental plants. Primetime farmers mostly practice monoculture, i.e., cultivating a single crop for their primary income in a very large area, leading to an increase in weed infestation and reduced yields. Johnsongrass, barnyard grass, Palmer amaranth, and prickly sid are major weeds found in the region.
- The global herbicide market is projected to register a CAGR of 5.1% during the forecast period (2023-2029). The rising crop losses, the need to protect crops, increasing awareness of weed control, and rising demand for agriculture products are driving the market's growth.
Global Herbicide Market Trends
The high ability of weeds to adapt to different environments and develop resistance is leading to higher herbicide application rates
- The global average per-hectare consumption of herbicides increased by 44.4% during the historical period, from 1.8 kg/ha in 2017 to 2.6 kg/ha in 2022. The need for increased application of chemical herbicides is growing Y-o-Y as the adaptability and rapid reproduction of weeds make them highly competitive with crops, leading to higher yield losses. Hence, there is a growing need for more herbicide applications to control weeds and prevent reduced agricultural productivity.
- Herbicides are the most applied chemical pesticides compared to fungicides and insecticides. Among all the regions, South America had the highest per-hectare consumption in 2022, accounting for 5.3 kg, attributed to its extensive production of crops such as soybeans, corn, and sugarcane, which often involves large-scale commercial farming and high-density planting. Intensive agricultural practices contribute to higher weed pressure, necessitating herbicides to manage weed populations and protect crop yields effectively. South America was followed by North America and Europe, with an average per hectare consumption of 1.8 kg and 1.7 kg, respectively, in 2022.
- The rising prevalence and spread of herbicide-resistant weeds have become a growing issue for farmers across the globe, leading to the escalated usage of herbicides or the application of multiple herbicides to combat these resistant weed populations. For instance, palmer amaranth and common water hemp are resistant to glyphosate, horseweed and giant ragweed are resistant to multiple herbicides, and kochia is resistant to acetolactate synthase-inhibiting herbicides.
- The need for herbicide application is increasing drastically due to factors like the high ability of weeds to adapt to different environments and develop resistance.
2,4-D and glyphosate are widely used herbicides globally for selective control of broadleaf weeds
- Metribuzin is a herbicide belonging to the chemical class of triazines. It was priced at USD 16.6 thousand per metric ton. It is widely used to control various weed species in crops. Metribuzin specifically targets the photosystem II (PSII) protein complex in chloroplasts, disrupting the plants' ability to convert light energy into chemical energy during photosynthesis. This leads to the accumulation of toxic by-products and, ultimately, the death of the targeted weeds.
- Atrazine is an herbicide widely used to control broadleaf and grassy weeds like Echinochloa, Elusine spp., and Amaranthus viridis in maize and rice crops. The herbicide was valued at USD 13.5 thousand in 2022. India is the largest importer of atrazine technical worldwide, while China is the largest exporter.
- Paraquat is a widely used herbicide belonging to the chemical class of bipyridylium compounds. Due to its rapid action and non-selective nature, paraquat is commonly used as a pre-plant or pre-emergence herbicide to control weeds before crops emerge. It is effective in a wide range of crops, including cotton, corn, soybeans, and sugarcane. Paraquat was priced at USD 7.0 thousand in 2022.
- Pendimethalin is a herbicide belonging to the chemical class of dinitroanilines. It is widely used to control various annual grasses and broadleaf weeds in agricultural crops. It was priced at USD 3.3 thousand per metric ton in 2022. By disrupting early weed development, pendimethalin helps reduce weed competition with crops during their early growth stages.
- 2,4-D and glyphosate are widely used herbicides globally for selective control of broadleaf weeds. They were priced at USD 2.3 thousand and USD 1.1 thousand, respectively, in 2022.
Herbicide Industry Overview
The Herbicide Market is fairly consolidated, with the top five companies occupying 69.12%. The major players in this market are BASF SE, Bayer AG, Corteva Agriscience, Nufarm Ltd and Syngenta Group (sorted alphabetically).
Additional Benefits:
- The market estimate (ME) sheet in Excel format
- 3 months of analyst support
TABLE OF CONTENTS
1 EXECUTIVE SUMMARY & KEY FINDINGS
2 REPORT OFFERS
3 INTRODUCTION
- 3.1 Study Assumptions & Market Definition
- 3.2 Scope of the Study
- 3.3 Research Methodology
4 KEY INDUSTRY TRENDS
- 4.1 Consumption Of Pesticide Per Hectare
- 4.2 Pricing Analysis For Active Ingredients
- 4.3 Regulatory Framework
- 4.3.1 Argentina
- 4.3.2 Australia
- 4.3.3 Brazil
- 4.3.4 Canada
- 4.3.5 Chile
- 4.3.6 China
- 4.3.7 France
- 4.3.8 Germany
- 4.3.9 India
- 4.3.10 Indonesia
- 4.3.11 Italy
- 4.3.12 Japan
- 4.3.13 Mexico
- 4.3.14 Myanmar
- 4.3.15 Netherlands
- 4.3.16 Pakistan
- 4.3.17 Philippines
- 4.3.18 Russia
- 4.3.19 South Africa
- 4.3.20 Spain
- 4.3.21 Thailand
- 4.3.22 Ukraine
- 4.3.23 United Kingdom
- 4.3.24 United States
- 4.3.25 Vietnam
- 4.4 Value Chain & Distribution Channel Analysis
5 MARKET SEGMENTATION (includes market size in Value in USD and Volume, Forecasts up to 2030 and analysis of growth prospects)
- 5.1 Application Mode
- 5.1.1 Chemigation
- 5.1.2 Foliar
- 5.1.3 Fumigation
- 5.1.4 Soil Treatment
- 5.2 Crop Type
- 5.2.1 Commercial Crops
- 5.2.2 Fruits & Vegetables
- 5.2.3 Grains & Cereals
- 5.2.4 Pulses & Oilseeds
- 5.2.5 Turf & Ornamental
- 5.3 Region
- 5.3.1 Africa
- 5.3.1.1 By Country
- 5.3.1.1.1 South Africa
- 5.3.1.1.2 Rest of Africa
- 5.3.2 Asia-Pacific
- 5.3.2.1 By Country
- 5.3.2.1.1 Australia
- 5.3.2.1.2 China
- 5.3.2.1.3 India
- 5.3.2.1.4 Indonesia
- 5.3.2.1.5 Japan
- 5.3.2.1.6 Myanmar
- 5.3.2.1.7 Pakistan
- 5.3.2.1.8 Philippines
- 5.3.2.1.9 Thailand
- 5.3.2.1.10 Vietnam
- 5.3.2.1.11 Rest of Asia-Pacific
- 5.3.3 Europe
- 5.3.3.1 By Country
- 5.3.3.1.1 France
- 5.3.3.1.2 Germany
- 5.3.3.1.3 Italy
- 5.3.3.1.4 Netherlands
- 5.3.3.1.5 Russia
- 5.3.3.1.6 Spain
- 5.3.3.1.7 Ukraine
- 5.3.3.1.8 United Kingdom
- 5.3.3.1.9 Rest of Europe
- 5.3.4 North America
- 5.3.4.1 By Country
- 5.3.4.1.1 Canada
- 5.3.4.1.2 Mexico
- 5.3.4.1.3 United States
- 5.3.4.1.4 Rest of North America
- 5.3.5 South America
- 5.3.5.1 By Country
- 5.3.5.1.1 Argentina
- 5.3.5.1.2 Brazil
- 5.3.5.1.3 Chile
- 5.3.5.1.4 Rest of South America
- 5.3.1 Africa
6 COMPETITIVE LANDSCAPE
- 6.1 Key Strategic Moves
- 6.2 Market Share Analysis
- 6.3 Company Landscape
- 6.4 Company Profiles (includes Global level Overview, Market level overview, Core Business Segments, Financials, Headcount, Key Information, Market Rank, Market Share, Products and Services, and analysis of Recent Developments)
- 6.4.1 ADAMA Agricultural Solutions Ltd
- 6.4.2 BASF SE
- 6.4.3 Bayer AG
- 6.4.4 Corteva Agriscience
- 6.4.5 FMC Corporation
- 6.4.6 Jiangsu Yangnong Chemical Co. Ltd
- 6.4.7 Nufarm Ltd
- 6.4.8 Sumitomo Chemical Co. Ltd
- 6.4.9 Syngenta Group
- 6.4.10 UPL Limited
7 KEY STRATEGIC QUESTIONS FOR CROP PROTECTION CHEMICALS CEOS
8 APPENDIX
- 8.1 Global Overview
- 8.1.1 Overview
- 8.1.2 Porter's Five Forces Framework
- 8.1.3 Global Value Chain Analysis
- 8.1.4 Market Dynamics (DROs)
- 8.2 Sources & References
- 8.3 List of Tables & Figures
- 8.4 Primary Insights
- 8.5 Data Pack
- 8.6 Glossary of Terms
02-2729-4219
+886-2-2729-4219
 Pyroxasulfone市場分析與2034年預測:類型、產品、應用、技術、最終用戶、形式、部署、材料類型、功能
 除草劑安全劑市場 - 全球產業規模、佔有率、趨勢、機會和預測,按類型、按作物、按除草劑、按應用階段、按地區和競爭進行細分,2020-2030F麥草畏除草劑市場 - 全球產業規模、佔有率、趨勢、機會和預測,按作物類型、配方、物理形態、使用模式、應用時間、地區和競爭進行細分,2020-2030 年預測
 中國除草劑市場:市場佔有率分析、產業趨勢與統計、成長預測(2025-2030)亞太除草劑:市場佔有率分析、產業趨勢和成長預測(2025-2030)北美除草劑:市場佔有率分析、產業趨勢和成長預測(2025-2030)南美除草劑:市場佔有率分析、產業趨勢和成長預測(2025-2030)印尼除草劑市場:佔有率分析、產業趨勢與成長預測(2025-2030年)印度除草劑:市場佔有率分析、產業趨勢與統計、成長預測(2025-2030)歐洲除草劑:市場佔有率分析、產業趨勢與統計、成長預測(2025-2030)
▼