


 |
市場調查報告書
商品編碼
1642115
全球廢棄物管理 -市場佔有率分析、行業趨勢和統計、成長預測(2025-2030 年)Global Waste Management - Market Share Analysis, Industry Trends & Statistics, Growth Forecasts (2025 - 2030) |
||||||
※ 本網頁內容可能與最新版本有所差異。詳細情況請與我們聯繫。
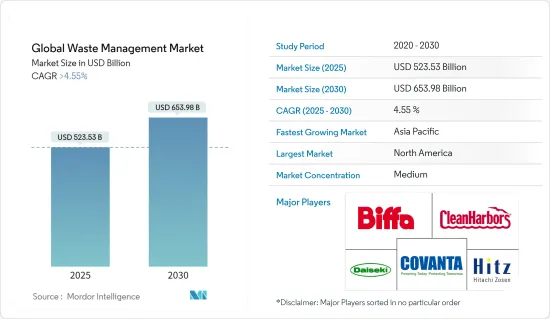
2025 年全球廢棄物管理市場規模預計為 5,235.3 億美元,預計到 2030 年將達到 6,539.8 億美元,預測期內(2025-2030 年)的複合年成長率超過 4.55%。
有幾個關鍵因素推動廢棄物管理市場的成長。首先,廢棄物產生量不斷增加,需要有效的廢棄物管理系統來應對日益加速的都市化和人口成長。固態廢棄物產生的增加是由於消費模式和城市生活方式的增加,因此需要找到有效管理的創新解決方案。
其次,人們對環境保護和永續性的認知不斷提高,對良好的廢棄物管理實踐的需求也不斷增加。消費者、工業界和政府都意識到減少廢棄物以及採用回收和循環經濟方法來減少對環境的影響的重要性。
全球每年產生超過20億噸都市固態廢棄物,預計2050年將增加70%左右。 2022年,每天有超過10,000噸廢棄物被運送到世界上最大的垃圾掩埋場。此外,廢棄物經常被傾倒在危險的封閉式垃圾掩埋場,尤其是在新興國家。鑑於各國的回收率差異很大,仍有很大的改進和發展空間。
此外,印度、中國和台灣等新興經濟體的工業產量正在增加,這得益於化學、石油和天然氣、汽車和醫療領域的發展,而這些領域排放了大量廢棄物和污染。
廢棄物管理市場趨勢
電子廢棄物佔比最大
開發、引進、成長、成熟、處置或回收都是電子產品日常生命週期的一部分。電子產品進入回收階段是因為它們已達到使用壽命、技術進步或市場需求改變。隨著技術的快速進步,新的電子設備和現有產品的改進版本(例如筆記型電腦、行動電話、電視等)不斷湧現。
鐵、銅、錫和鋁是電子廢棄物中的主要金屬,佔其重量的90%以上。然而,最有價值的金屬是鈀,每年為明尼蘇達州帶來超過 15 億美元的收入,鉑金估計為 10 億美元或以上,銅和錫估計各為 1 億美元。
若以人均計算,歐洲人體重最高(16.2公斤),其次是大洋洲(16.1公斤)和美洲(13.3公斤)。非洲居民的人均電子廢棄物產生量最少。
印度目前是繼美國和中國之後世界第三大電子廢棄物排放,且其數量還在穩定增加中。在印度,電腦設備佔電子廢棄物的近70%,其次是行動電話(12%),電器產品( 8%)和醫療設備(7%)。
在全球範圍內,只有不到 1% 的廢棄物被回收利用,儘管不同地區存在差異。據了解,全球僅有17.4%的電子廢棄物被收集並妥善回收。歐洲的收集和回收率高達42.5%。排名第二的是亞洲,佔 11.7%。非洲的失業率僅0.9%,為全球最低的。
由於先進電子電氣設備的普及,推動了用新設備取代舊設備的需求,北美和亞洲產生了約 2,490 萬噸電子廢棄物。
亞太地區成為全球最重要的廢棄物管理市場
預計「清潔印度運動」等政府措施以及亞太國家採取的零廢棄物計畫將提高人們對廢棄物管理的認知。預計這將對亞太地區的市場擴張產生正面影響。
2022年中國將佔全球塑膠材料產量的32%,成為全球最大的生產國。其他亞洲國家也是重要的塑膠生產國,其中日本佔全球塑膠產量的 3%,其他亞洲國家則佔全球塑膠產量的 17%。
該地區主要新興經濟體的快速工業化和政府對環境保護的嚴格監管預計將推動亞太地區廢棄物管理市場的成長。日本修訂後的《廢棄物管理和公共清潔法》要求企業主如果將廢棄物存放在產生廢棄物的營業場所外,則必須記錄位置和其他廢棄物資料。該修正案也要求原建築承包商負責妥善處理廢棄物。
例如,2022年,聯合國環境大會支持了一項終止塑膠污染的決議,並同意在2024年終前實施一項具有法律約束力的國際協議。艾倫麥克阿瑟基金會全球承諾的簽署方代表了塑膠包裝市場 20% 以上的佔有率,其中包括可口可樂公司和百事可樂公司。這些公司已經制定了雄心勃勃的 2025 年目標,以減少塑膠廢棄物並推動向循環經濟的轉型。
中國於2021年公佈了減少塑膠污染的五年行動計劃,其中包括禁止在超級市場、購物中心、大城市和宅配服務中使用可分解塑膠。繼去年成立日本循環經濟夥伴相關人員(J4CE)之後,政府將建立2022年日本循環經濟夥伴關係(J4CE)。
廢棄物管理產業概況
全球廢棄物管理市場競爭激烈,許多公司專注於創新技術來回收和再利用世界各地各行業和家庭產生的廢棄物。還有一些新興新興企業遵循零廢棄物3R(減少、再利用、回收)理念,持續致力於減少廢棄物。
其他福利
- Excel 格式的市場預測 (ME) 表
- 3 個月的分析師支持
目錄
第 1 章 簡介
- 研究假設和市場定義
- 研究範圍
第2章調查方法
第3章執行摘要
第4章 市場洞察與動態
- 市場概況
- 深入了解有效廢棄物管理的技術進步與創新
- 價值鏈/供應鏈分析
- 洞察新興企業進入全球廢棄物管理產業的策略
- 聚焦市場趨勢
- COVID-19 對市場的影響
第5章 市場動態
- 市場促進因素
- 城市人口不斷增加
- 廢棄物產生量增加
- 市場限制
- 新興國家缺乏認知
- 市場機會
- 新興國家高成長潛力
- 波特五力分析
- 新進入者的威脅
- 購買者和消費者的議價能力
- 供應商的議價能力
- 替代品的威脅
- 競爭對手之間的競爭強度
第6章 市場細分
- 依廢棄物類型
- 工業廢棄物
- 都市固態廢棄物
- 電子廢棄物
- 塑膠廢棄物
- 醫療及廢棄物廢棄物
- 按處置方式
- 掩埋
- 焚化
- 回收利用
- 按地區
- 北美洲
- 美國
- 加拿大
- 墨西哥
- 歐洲
- 英國
- 德國
- 法國
- 俄羅斯
- 歐洲其他地區
- 亞太地區
- 中國
- 日本
- 印度
- 韓國
- 其他亞太地區
- 中東和非洲
- 南非
- 沙烏地阿拉伯
- 卡達
- 其他中東和非洲地區
- 拉丁美洲
- 巴西
- 阿根廷
- 其他拉丁美洲國家
- 北美洲
第7章 競爭格局
- 公司簡介
- Biffa Group
- Clean Harbors, Inc.
- Covanta Holding Corporation
- Veolia Environment SA
- Waste Connections
- Remondis AG & Co. Kg
- Suez Environment SA
- Daiseki Co. Ltd
- Waste Management Inc.
- Republic Services
- Averda*
- 其他公司
第8章 市場機會與未來趨勢
第 9 章 附錄
The Global Waste Management Market size is estimated at USD 523.53 billion in 2025, and is expected to reach USD 653.98 billion by 2030, at a CAGR of greater than 4.55% during the forecast period (2025-2030).
Several key factors have led to the growth of the waste management market. First, the volume of waste produced has increased, and an effective waste management system is needed to cope with growing urbanization and population growth. The increased production of solid waste is due to the increase in consumption patterns and urban lifestyles, which makes it necessary to find innovative solutions for its efficient management.
Second, there has been an increased demand for good waste management practices due to growing awareness about the need to protect the environment and sustainability. Consumers, industry, and governments recognize the importance of reducing waste and adopting recycling and circular economy approaches to reduce their environmental footprint.
Over 2 billion tonnes of municipal solid waste are produced worldwide every year, and this figure is projected to grow by approximately 70 % until 2050. Over 10,000 tonnes of waste per day were transported to the world's most giant landfills in 2022. In addition, especially in emerging countries, waste is frequently dumped at dangerous closed landfills. There is still much room for improvement and development, given that recycling rates vary widely from country to country.
Furthermore, the development of chemical, oil & gas, automotive, and medical sectors that produce vast amounts of waste and cause pollution is due to increased industrial production in developing countries like India, China or Taiwan.
Waste Management Market Trends
E-waste segment holds the largest share
Development, introduction, growth, maturation, and disposal or recycling are all parts of the everyday life cycle of an electronic product. When an electronic product reaches the recycling stage, it may be because of the end of its useful life, technological advancements, or shifting market demands. New electronic devices and improved models of already-existing products, such as laptops, mobile phones, and televisions, are produced as a result of the rapid improvements in technology.
Iron, copper, tin, and aluminum are the primary metals in e-waste, accounting for more than 90 % of its weight. But the metals with the highest value are palladium, over an estimated USD 1.5 billion in e-waste produced annually in Minnesota; platinum, over an estimated USD 1 billion; copper, and tin, over an estimated USD 100 million each.
When measured per capita, Europeans (16.2 Kg) produce the most e-waste per person, followed by Oceania (16.1 Kg) and the Americas (13.3 Kg). African residents have the least amount of e-waste per capita.
India is now the world's third largest electronic waste producer after the US and China, with steadily increasing volume growth. In India, computer equipment represents nearly 70% of e-waste, followed by cell phones at 12%, electric appliances at 8%, and healthcare devices at 7%.
Globally, less than 1 % of waste is recycled, although this varies from region to region. It is known that only 17.4% of total global e-waste is collected and properly recycled. The rate of collection and recycling in Europe is by far the highest in the world at 42.5%. In second place, Asia had a rate of 11.7%. At just 0.9%, Africa is the lowest in the world.
Due to the increasing adoption of Advanced Electronic and Electrical Devices, which drive demand for replacing obsolete devices with new ones, North America and Asia accounted for approximately 24.9 million tonnes of e-waste.
Asia Pacific Emerged as the Most Significant Global Waste Management Market
Awareness about waste management is projected to increase due to government initiatives like the Swacch Bharat Abhiyan and the zero waste plans adopted by various Asia Pacific nations. This will have a favorable effect on expanding the market in the Asia Pacific.
China accounted for 32 percent of global plastic materials production in 2022, making it the world's largest producer. Other Asian countries were also significant plastic manufacturers, with Japan's production amounting to 3% of the global plastic production and the rest of Asia producing 17% of the world's plastic.
Rapid industrialization in major emerging economies in the region and stringent government regulations towards environmental protection are expected to boost the growth of the Asia-Pacific waste management market. The amended Waste Disposal and Cleaning Law of Japan requires company owners to record the location and other waste data when such items are stored outside of the business sites that generate them. The amendment also holds the original building contractors accountable for proper waste disposal.
In 2022, for example, the United Nations Environment Assembly endorsed a resolution to end plastic pollution and agreed to implement an international, legally binding agreement by the end of 2024. The Ellen MacArthur Foundation's Global Commitment has signatories accounting for more than 20% of the plastic packaging market, including companies such as The Coca-Cola Company and PepsiCo, who have set ambitious 2025 targets to reduce plastic waste and progress the move to a circular economy.
China announced its five-year action plan for reducing plastic pollution in 2021, including bans on non-degradable plastic bags in supermarkets and shopping malls, major cities, and food delivery services. Japan enacted its Plastic Resource Circulation Act in 2022, following the founding of the Japan Partnership for Circular Economy (J4CE) the year before "for the purpose of strengthening public and private partnerships, with the aim of further fostering understanding of the circular economy among a wide range of stakeholders."
Waste Management Industry Overview
The global waste management market is highly competitive, with many players focused on innovative technologies to recycle and reuse the waste generated across various industries and households across the globe. There are also several startups coming up in the industry that are continuously focusing on waste reduction following the Zero Waste - 3R (Reduce, Reuse, and Recycle) philosophy.
Additional Benefits:
- The market estimate (ME) sheet in Excel format
- 3 months of analyst support
TABLE OF CONTENTS
1 INTRODUCTION
- 1.1 Study Assumptions and Market Definition
- 1.2 Scope of the Study
2 RESEARCH METHODOLOGY
3 EXECUTIVE SUMMARY
4 MARKET INSIGHTS and DYNAMICS
- 4.1 Market Overview
- 4.2 Insights into Technological Advancements and Innovation in Effective Waste Management
- 4.3 Value Chain/Supply Chain Analysis
- 4.4 Insights on Strategies of Rising Startups Venturing into the Global Waste Management Industry
- 4.5 Spotlight on Market Trends
- 4.6 Impact of COVID-19 on the Market
5 MARKET DYNAMICS
- 5.1 Market Drivers
- 5.1.1 Growth in urban population
- 5.1.2 Increase in amount of waste generation
- 5.2 Market Restraints
- 5.2.1 Lack of awareness in developing countries
- 5.3 Market Opportunities
- 5.3.1 High growth potential in emerging economies
- 5.4 Porter's Five Forces Analysis
- 5.4.1 Threat of New Entrants
- 5.4.2 Bargaining Power of Buyers/Consumers
- 5.4.3 Bargaining Power of Suppliers
- 5.4.4 Threat of Substitute Products
- 5.4.5 Intensity of Competitive Rivalry
6 MARKET SEGMENTATION
- 6.1 By Waste type
- 6.1.1 Industrial waste
- 6.1.2 Municipal solid waste
- 6.1.3 E-waste
- 6.1.4 Plastic waste
- 6.1.5 Biomedical and Other Waste Types
- 6.2 By Disposal methods
- 6.2.1 Landfill
- 6.2.2 Incineration
- 6.2.3 Recycling
- 6.3 Geography
- 6.3.1 North America
- 6.3.1.1 United States
- 6.3.1.2 Canada
- 6.3.1.3 Mexico
- 6.3.2 Europe
- 6.3.2.1 United Kingdom
- 6.3.2.2 Germany
- 6.3.2.3 France
- 6.3.2.4 Russia
- 6.3.2.5 Rest of Europe
- 6.3.3 Asia-Pacific
- 6.3.3.1 China
- 6.3.3.2 Japan
- 6.3.3.3 India
- 6.3.3.4 South Korea
- 6.3.3.5 Rest of Asia-Pacific
- 6.3.4 Middle East & Africa
- 6.3.4.1 South Africa
- 6.3.4.2 Saudi Arabia
- 6.3.4.3 Qatar
- 6.3.4.4 Rest of Middle East and Africa
- 6.3.5 Latin America
- 6.3.5.1 Brazil
- 6.3.5.2 Argentina
- 6.3.5.3 Rest of Latin America
- 6.3.1 North America
7 COMPETITIVE LANDSCAPE
- 7.1 Overview (Market Concentration and Major Players)
- 7.2 Company Profiles
- 7.2.1 Biffa Group
- 7.2.2 Clean Harbors, Inc.
- 7.2.3 Covanta Holding Corporation
- 7.2.4 Veolia Environment SA
- 7.2.5 Waste Connections
- 7.2.6 Remondis AG & Co. Kg
- 7.2.7 Suez Environment S.A.
- 7.2.8 Daiseki Co. Ltd
- 7.2.9 Waste Management Inc.
- 7.2.10 Republic Services
- 7.2.11 Averda*
- 7.3 Other Companies
8 MARKET OPPORTUNITIES AND FUTURE TRENDS
9 APPENDIX
 灰渣處理系統市場-全球產業規模、佔有率、趨勢、機會和預測(按類型、按灰渣類型、按最終用途行業、按地區和按競爭細分,2020-2030 年預測)2025年全球水和廢棄物管理諮詢服務市場報告
 全球多氟烷基物質 (PFAS) 廢棄物管理市場研究報告 - 產業分析、規模、佔有率、成長、趨勢和預測 2025 年至 2033 年2025 年廢棄物管理與收集服務全球市場報告
 亞太地區廢棄物管理:市場佔有率分析、產業趨勢和成長預測(2025-2030)全球氣動廢棄物管理系統市場 -市場佔有率分析、產業趨勢與統計、成長預測(2025-2030 年)北美廢棄物管理:市場佔有率分析、產業趨勢和成長預測(2025-2030)北美都市固態廢棄物管理 -市場佔有率分析、產業趨勢與統計、成長預測(2025-2030)建築廢棄物管理:市場佔有率分析、產業趨勢與統計、成長預測(2025-2030)越南廢棄物管理:市場佔有率分析、產業趨勢與統計、成長預測(2025-2030 年)