


 |
市場調查報告書
商品編碼
1683431
美國生物刺激素市場:市場佔有率分析、產業趨勢與成長預測(2025-2030 年)United States Biostimulants - Market Share Analysis, Industry Trends & Statistics, Growth Forecasts (2025 - 2030) |
||||||
價格
※ 本網頁內容可能與最新版本有所差異。詳細情況請與我們聯繫。
簡介目錄
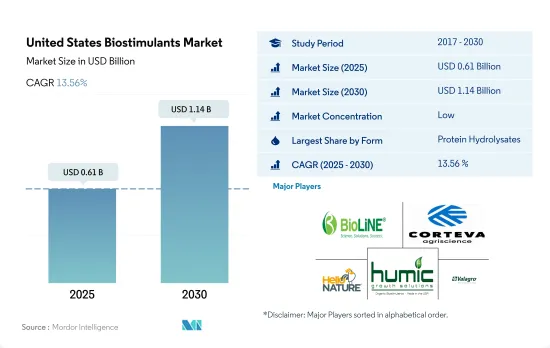
預計 2025 年美國生物刺激素市場規模為 6.1 億美元,到 2030 年將達到 11.4 億美元,預測期內(2025-2030 年)的複合年成長率為 13.56%。
- 美國生物刺激素市場由許多活性成分組成,包括腐殖酸和富裡酸酸、胺基酸、蛋白質水解物、海藻萃取物以及其他有機植物和動物來源的生物刺激素。
- 在美國生物刺激素市場中,蛋白質水解物佔有最高佔有率,到 2022 年將佔 37.3% 的佔有率。 2022 年的市場規模為 1.555 億美元,消費量為 14,300 噸。蛋白質水解物由於能夠提高農業和園藝作物的產量和品質而佔據了較高的市場佔有率。
- 腐植酸緊隨蛋白水解物之後,2022年的市場佔有率為27.6%。腐殖酸有助於改善大豆、小麥、水稻和玉米等作物的根系;馬鈴薯、番茄、黃瓜和辣椒等蔬菜作物;以及柑橘(Citrus limon)和葡萄(Vitis vinifera)等水果作物。
- 田間作物的有機面積最大,佔生物刺激素消費量的大部分,即 2022 年的 71.4%。緊隨作物的是園藝作物和經濟作物,同年分別佔 27.5% 和 1.1%。
- 儘管科學文獻報導了生物刺激素對多種作物具有潛在的積極作用,但全國許多州,尤其是佛羅裡達州和加利福尼亞州,基本上缺乏關於生物刺激素對柑橘類水果和草莓等商業種植作物以及番茄和辣椒等蔬菜的影響的了解。
- 有機產品需求的不斷成長、農業的進步、農業中生物資源的使用不斷增加以及政府的支持政策是推動美國生物刺激素市場發展的因素之一。
美國生物刺激素市場趨勢
透過國家立法增加有機種植面積,特別是連續作物
- 2021年,美國有機農業面積為623,000公頃。過去二十年,美國的有機農業取得了長足的發展,這主要歸功於具體法律法規的實施。 2021年加州有機農場和牧場數量為3061個,是美國獲得認證的有機農場最多的州。賓州有超過 1,125 個經過認證的有機農場。 2019 年,獲得認證的有機農場有近 15,548,000 個,運作作物;有 7,139,000 個,經營牧場和草場。包括苗圃和溫室在內的作物銷售額達到近 58 億美元。
- 該國的有機農業以耕作作物為主。 2021年,其約佔有機農地總面積的71.8%。穀類生產在該國農業中占主導地位。主要穀物有玉米、小麥、米、小米。有機產品的消費在美國消費者中越來越受歡迎,越來越多的消費者因為有機食品具有多種健康益處而選擇有機食品。
- 有機園藝作物的總種植面積正在增加,從 2017 年的 112,900 公頃增加到 2021 年的 156,100 公頃。就 2021 年國內產量而言,前五的水果和蔬菜是蘋果(31.1%)、草莓(9.5%)、橘子(6.9%)、長葉萵苣(6.7%)和馬鈴薯(6.2%)。在貿易方面,進口額最大的產品是香蕉(53.1%)、酪梨(7.7%)、芒果(5.8%)、藍莓(5.0%)和南瓜(4.3%),出口額最大的產品是蘋果(80.0%)、梨子(14.4%)、櫻桃(4.0%)、洋蔥乾(1.5%)。
有機農產品需求不斷成長,尤其是水果和蔬菜領域,人均有機食品支出不斷增加
- 美國是世界最大的有機產品消費國。根據《營養商業日誌》(NBJ,2021年)報道,截至 2020 年,該國有機食品總銷售額達 516 億美元。美國是北美地區有機產品人均支出最高的國家,2021年為186.7美元。
- 自有機食品零售業成立以來,有機新鮮水果和蔬菜一直是有機食品的主要類別。 2020 年,這些有機產品的零售額達到 200 億美元,顯示對有機農產品的需求不斷成長。過去二十年來,對有機新鮮水果和蔬菜的需求穩定成長。有機食品銷售的成長是由於消費者意識的增強,尤其是高所得族群。需求量最大的有機食品類別包括雞蛋、乳製品、水果和蔬菜等主食。
- 不同人口和地區的人們對有機食品的偏好各不相同。 18-29 歲的年輕人比 65 歲以上的老年人更有可能想要有機產品(超過 50%)。收入和地區也起著一定的作用,收入低於 30,000 美元的人中有 42% 想要購買有機產品,而收入超過 75,000 美元的人中有 49% 想要購買有機產品。
- 該國在有機產品上的人均支出正在增加,2017-2021 年期間的複合年成長率為 5.2%。有機產品的需求不斷增加,為美國有機生產商創造了進入國內和國際高價值市場的機會。有機產品的價格溢價是低收入消費者消費有機食品的主要限制因素之一。
美國生物刺激素產業概況
美國生物刺激素市場細分化,前五大公司佔6.66%。市場的主要企業是 BioLine Corporation、Corteva Agriscience、Hello Nature USA Inc.、Humic Growth Solutions Inc. 和 Valagro USA。
其他福利
- Excel 格式的市場預測 (ME) 表
- 3 個月的分析師支持
目錄
第 1 章執行摘要和主要發現
第2章 報告要約
第 3 章 簡介
- 研究假設和市場定義
- 研究範圍
- 調查方法
第4章 產業主要趨勢
- 有機栽培面積
- 有機產品人均支出
- 法律規範
- 美國
- 價值鏈與通路分析
第5章 市場區隔
- 形式
- 胺基酸
- 富裡酸
- 腐植酸
- 蛋白質水解物
- 海藻萃取物
- 其他生物刺激素
- 作物類型
- 經濟作物
- 園藝作物
- 田間作物
第6章 競爭格局
- 重大策略舉措
- 市場佔有率分析
- 業務狀況
- 公司簡介包括全球概況、市場層級概況、主要業務部門、財務狀況、員工人數、關鍵資訊、市場排名、市場佔有率、產品和服務以及最新發展分析。
- BioLine Corporation
- Corteva Agriscience
- FBSciences Inc.
- Hello Nature USA Inc.
- Humic Growth Solutions Inc.
- Ocean Organics Corp.
- Plant Response BIoTech Inc.
- Sigma Agriscience LLC
- Symborg Inc.
- Valagro USA
第7章:執行長的關鍵策略問題
第 8 章 附錄
- 世界概況
- 概述
- 五力分析框架
- 全球價值鏈分析
- 市場動態(DRO)
- 資訊來源和進一步閱讀
- 圖片列表
- 關鍵見解
- 資料包
- 詞彙表
簡介目錄
Product Code: 70069
The United States Biostimulants Market size is estimated at 0.61 billion USD in 2025, and is expected to reach 1.14 billion USD by 2030, growing at a CAGR of 13.56% during the forecast period (2025-2030).
- The biostimulants market in the United States consists of many active ingredients, such as humic and fulvic acids, amino acids, protein hydrolysates, seaweed extracts, and other biostimulants like organic plants and animal derivatives.
- Protein hydrolysates held the highest share in the US biostimulants market, with a share of 37.3% in 2022. The market was valued at USD 155.5 million in 2022, with a consumption volume of 14.3 thousand metric tons. The use of protein hydrolysates can improve yield and quality traits in agricultural and horticultural crops, thus leading to their high share.
- Humic acids followed protein hydrolysates, accounting for a market share of 27.6% in 2022. Humic acids help improve the root system of crops such as soybean, wheat, rice, and maize; vegetable crops such as potato, tomato, cucumber, and pepper; and fruit crops such as citrus (Citrus limon) and grape (Vitis vinifera).
- The field crops held the maximum area under organic cultivation and accounted for a significant share of biostimulant consumption, i.e., 71.4% in 2022. These crops were followed by horticultural and cash crops, with shares of 27.5% and 1.1% in the same year, respectively.
- Despite the potentially positive effects on different crops reported in the scientific literature, there is little knowledge regarding biostimulant effects on commercially grown crops like citrus and strawberry and vegetables like tomato and capsicum, particularly in many states of the country, like Florida and California.
- The growing demand for organic products, the advancement of the agricultural industry, the increasing use of bio-based resources in farming, and supportive government policies drive the US market for biostimulants.
United States Biostimulants Market Trends
Increase in organic area, particularly in row crops, due to country's laws and regulations
- In 2021, the area under organic agricultural farming in the United States was 623 thousand hectares. Organic agriculture in the United States has increased significantly in the previous 20 years, mostly due to the introduction of particular laws and regulations. The number of organic farms and ranches in California was 3,061 in 2021, the largest number of certified organic farms in the United States. There were over 1,125 certified organic farms in Pennsylvania. Nearly 15,548 thousand certified organic farms in operation used cropland in 2019, while 7,139 thousand farms operated pastureland and rangeland. The sales value of crops, including those from nurseries and greenhouses, amounted to nearly USD 5.8 billion.
- Row crops dominated organic farming in the nation. In 2021, they accounted for about 71.8% of all organic cropland. The production of cereal crops predominates the country's agricultural sector. The main cereals include maize, wheat, rice, and millet. The consumption of organic products has become popular among US consumers who increasingly choose to eat organic foods because of their various health benefits.
- There is an increasing trend in the overall organic horticultural crop cultivation area, from 112.9 thousand hectares in 2017 to 156.1 thousand hectares in 2021. Regarding domestic production in 2021, the top five fruits and vegetables were apples (31.1%), strawberries (9.5%), oranges (6.9%), romaine lettuce (6.7%), and potatoes (6.2%). In the case of trade, the most imported produce was bananas (53.1%), avocados (7.7%), mangoes (5.8%), blueberries (5.0%), and squashes (4.3%), while the most exported were apples (80.0%), pears (14.4%), cherries (4.0%), dried onions (1.5%), and potatoes (0.2%).
Growing demand for organic produce especially in the fruits and vegetables sector, rise in per capita spending on organic food
- The United States is one of the largest organic product consumers in the world. As of 2020, the total sales of organic food products in the country accounted for USD 51.6 billion, according to the Nutrition Business Journal (NBJ, 2021). The United States had the largest per capita spending on organic products in the North American region, worth USD 186.7 in 2021.
- Organic fresh fruits and vegetables have been the leading category of organic food since the establishment of the organic food retail industry. In 2020, retail sales for these organic products were valued at USD 20.0 billion, showing a growing demand for organic produce. The demand for organic fresh fruits and vegetables has steadily risen over the past two decades. Organic food sales are rising due to growing consumer awareness, especially among high-income consumers. The most in-demand organic categories include basic foods like eggs, dairy, fruits, and vegetables.
- Organic food preferences vary by demographic and region. Younger people aged between 18 and 29 are more likely to seek organic products (over 50%) compared to older people aged 65 and above. Income and region also play a role, with 42% of those with under USD 30,000 income and 49% of those with over USD 75.0 thousand seeking organic products.
- The per capita spending on organic products is increasing in the country, recording a CAGR of 5.2% between 2017 and 2021. The growing demand for organic products is creating opportunities for US organic producers to tap into high-value markets both domestically and abroad. The price premium associated with organic products is one of the major limiting factors for organic food consumption for low-income consumers.
United States Biostimulants Industry Overview
The United States Biostimulants Market is fragmented, with the top five companies occupying 6.66%. The major players in this market are BioLine Corporation, Corteva Agriscience, Hello Nature USA Inc., Humic Growth Solutions Inc. and Valagro USA (sorted alphabetically).
Additional Benefits:
- The market estimate (ME) sheet in Excel format
- 3 months of analyst support
TABLE OF CONTENTS
1 EXECUTIVE SUMMARY & KEY FINDINGS
2 REPORT OFFERS
3 INTRODUCTION
- 3.1 Study Assumptions & Market Definition
- 3.2 Scope of the Study
- 3.3 Research Methodology
4 KEY INDUSTRY TRENDS
- 4.1 Area Under Organic Cultivation
- 4.2 Per Capita Spending On Organic Products
- 4.3 Regulatory Framework
- 4.3.1 United States
- 4.4 Value Chain & Distribution Channel Analysis
5 MARKET SEGMENTATION (includes market size in Value in USD and Volume, Forecasts up to 2030 and analysis of growth prospects)
- 5.1 Form
- 5.1.1 Amino Acids
- 5.1.2 Fulvic Acid
- 5.1.3 Humic Acid
- 5.1.4 Protein Hydrolysates
- 5.1.5 Seaweed Extracts
- 5.1.6 Other Biostimulants
- 5.2 Crop Type
- 5.2.1 Cash Crops
- 5.2.2 Horticultural Crops
- 5.2.3 Row Crops
6 COMPETITIVE LANDSCAPE
- 6.1 Key Strategic Moves
- 6.2 Market Share Analysis
- 6.3 Company Landscape
- 6.4 Company Profiles (includes Global Level Overview, Market Level Overview, Core Business Segments, Financials, Headcount, Key Information, Market Rank, Market Share, Products and Services, and Analysis of Recent Developments).
- 6.4.1 BioLine Corporation
- 6.4.2 Corteva Agriscience
- 6.4.3 FBSciences Inc.
- 6.4.4 Hello Nature USA Inc.
- 6.4.5 Humic Growth Solutions Inc.
- 6.4.6 Ocean Organics Corp.
- 6.4.7 Plant Response Biotech Inc.
- 6.4.8 Sigma Agriscience LLC
- 6.4.9 Symborg Inc.
- 6.4.10 Valagro USA
7 KEY STRATEGIC QUESTIONS FOR AGRICULTURAL BIOLOGICALS CEOS
8 APPENDIX
- 8.1 Global Overview
- 8.1.1 Overview
- 8.1.2 Porter's Five Forces Framework
- 8.1.3 Global Value Chain Analysis
- 8.1.4 Market Dynamics (DROs)
- 8.2 Sources & References
- 8.3 List of Tables & Figures
- 8.4 Primary Insights
- 8.5 Data Pack
- 8.6 Glossary of Terms
02-2729-4219
+886-2-2729-4219
 全球生物刺激素市場 - 2025 至 2032 年
 亞太生物刺激素:市場佔有率分析、產業趨勢與成長預測(2025-2030 年)北美生物刺激素:市場佔有率分析、產業趨勢與成長預測(2025-2030 年)南美生物刺激素:市場佔有率分析、產業趨勢與成長預測(2025-2030 年)生物刺激素:市場佔有率分析、產業趨勢與統計、成長預測(2025-2030 年)非洲生物刺激素:市場佔有率分析、產業趨勢與成長預測(2025-2030 年)
 2025年生物刺激素全球市場報告腐植酸生物刺激素全球市場報告 2025
 2025-2033 年按產品類型、作物類型、形式、原產地、配銷通路、應用、最終用戶和地區分類的生物促效劑市場報告
 生物刺激素市場規模、佔有率、成長分析,按活性成分、作物類型、應用、地區 - 產業預測,2024-2031
▼