


 |
市場調查報告書
商品編碼
1685909
生物刺激素:市場佔有率分析、產業趨勢與統計、成長預測(2025-2030 年)Biostimulants - Market Share Analysis, Industry Trends & Statistics, Growth Forecasts (2025 - 2030) |
||||||
價格
※ 本網頁內容可能與最新版本有所差異。詳細情況請與我們聯繫。
簡介目錄
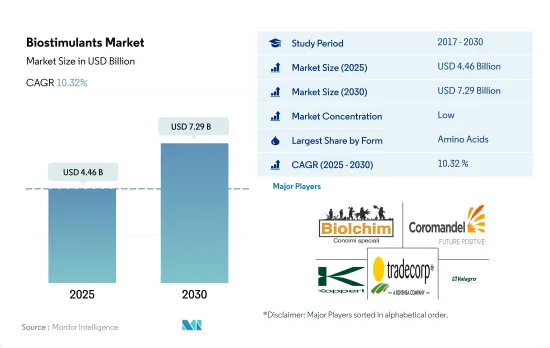
生物刺激素市場規模預計在 2025 年為 44.6 億美元,預計到 2030 年將達到 72.9 億美元,預測期內(2025-2030 年)的複合年成長率為 10.32%。
- 近年來,隨著農民越來越意識到生物刺激素產品對作物生長和產量的益處,生物刺激素在農業中的應用也日益增加。生物刺激素是促進植物生長並改善營養吸收、抗逆性和整體健康的天然或合成物質。
- 胺基酸成為全球消費量最大的生物刺激素,2022 年的市場佔有率為 32.0%。這一高佔有率主要歸因於噴灑氨基酸對作物產生的正面影響,例如增加了歐洲國家冬小麥作物的種子產量和每穗粒數。生物刺激素在連續作物中的消費量最高,佔2022年74.6%的市場佔有率,其次是園藝作物和經濟作物。
- 生物刺激素領域將以歐洲為主導,2022 年的市場佔有率為 40.6%,其次是北美和亞太地區。這一高比例得益於該地區農民的意識很高,以及政府對有機農業的推廣,目標是到2030年使25.0%的農地實現有機化。
- 受有機產品需求不斷成長和有機作物面積增加的推動,生物刺激素領域預計在 2023 年至 2029 年期間的複合年成長率為 10.1%。
- 生物刺激素在農業領域越來越受歡迎,可以減少化學肥料和農藥的使用。健康成長的有機食品產業也是生物刺激素市場成長的主要動力。
- 歐洲是全球最大的生物刺激素市場,2022年價值為13億美元,佔市場金額的40.6%。歐盟委員會已為成員國設定了將25%的農業用地轉變為有機農業的目標,這強化了歐洲生物經濟智慧成長與創新的關鍵優先事項。生物刺激素是實現此目的的重要成分。德國透過投資研發來提高生物刺激素的有效性,在實現這些目標方面發揮主導作用。
- 北美是全球生物刺激素市場的第二大市場,2022 年市場規模為 8.402 億美元。該地區的國家正在推出增加有機農業的政策,包括美國農業部的有機轉型計劃,到 2022 年將投資 3 億美國。該舉措旨在鼓勵農民之間的指導,包括向農民提供財政支持並提高人們對生物刺激素有益影響的認知。
- 亞太地區在生物刺激素市場上佔據第三大地位,其中中國是世界上最大的肥料消費國,已經在作物生產中使用有機投入品。同樣,由於生產商的認知不斷提高,南美和非洲的生物刺激素市場也出現了波動。預計化學投入品使用的減少和全球有機種植面積的增加將推動生物刺激素市場在預測期內以 10.1% 的複合年成長率成長。
全球生物刺激素市場趨勢
意識的增強和政府的舉措正在推動北美和歐洲的有機生產。
- 有機農業已成為永續糧食系統的主要貢獻者,並已在全球 187 個國家實踐。截至2021年,全球有機農地面積為7,230萬公頃,2018年至2021年各地區平均成長2.9%。其中,2021年有機種植面積為1,440萬公頃,佔有機農地總面積的19.9%。有機農業最強勁的市場是北美和歐洲,佔2022年世界有機耕地面積的41.0%。 2022年,歐洲的有機耕地面積將為650萬公頃,佔有機耕地總面積的44.1%。北美和歐洲最重要的有機作物包括蘋果、草莓、穀物和橄欖。
- 亞太地區的新興國家也正在加入有機農業運動,並在生產和供應新鮮有機農產品方面實現自給自足,以滿足國內需求。亞太地區有機農業呈現成長趨勢,2017年至2022年有機耕地面積將成長18.8%。該地區政府的主要措施也在促進有機農業發展方面發揮關鍵作用。例如,日本的2021年基本農業管理計畫旨在2030年將有機農民的數量和有機耕地面積增加兩倍。
- 有機農業在世界各地越來越受歡迎,許多國家都採用有機農業來實現永續的糧食體系。有機農業的成長源於人們對其益處的認知不斷提高,例如促進土壤健康、減少環境影響和生產更健康的食品。
人均有機食品支出的成長主要出現在美國和德國,這是由消費者對更健康、更永續食品的需求所推動的。
- 過去十年,有機食品市場經歷了顯著成長,全球銷售額預計將從 2012 年的 708 億美元成長到 2020 年的 1,206 億美元。有機食品的流行趨勢受到多種因素的推動,包括消費者對更健康、更永續的食品選擇的需求不斷成長,以及對傳統農業對環境影響的認知不斷提高。
- 根據有機貿易協會的調查,2021年有機蔬果銷量年增約4.5%,佔有機產品總銷售量的15%。目前,北美在有機產品平均支出方面佔據市場主導地位,2021年美國的人均支出達到186.7美元,是北美國家中最高的。歐洲有機市場預計也將強勁成長,其中德國 2019 年人均有機消費最高,達到 75.6 美元。
- 有機食品市場仍由可支配收入較高的已開發國家主導,但預計在新興國家也將成長。例如,在亞太地區,不斷壯大的工人階級可能會促進市場擴張。隨著有機產品越來越普及,它們的價格也越來越便宜。
- 有機食品市場在全球範圍內經歷了顯著的成長,預計在預測期內仍將持續成長。
生物刺激素產業概況
生物刺激素市場較為分散,前五大公司市佔率合計為11.95%。市場的主要企業是:Biolchim SpA、Coromandel International Ltd、Koppert Biological Systems Inc.、Trade Corporation International 和 Valagro(按字母順序排列)。
其他福利
- Excel 格式的市場預測 (ME) 表
- 3 個月的分析師支持
目錄
第 1 章執行摘要和主要發現
第2章 報告要約
第 3 章 簡介
- 研究假設和市場定義
- 研究範圍
- 調查方法
第4章 產業主要趨勢
- 有機栽培面積
- 有機產品人均支出
- 法律規範
- 阿根廷
- 澳洲
- 巴西
- 加拿大
- 中國
- 埃及
- 法國
- 德國
- 印度
- 印尼
- 義大利
- 日本
- 墨西哥
- 荷蘭
- 奈及利亞
- 菲律賓
- 俄羅斯
- 南非
- 西班牙
- 泰國
- 土耳其
- 英國
- 美國
- 越南
- 價值鏈與通路分析
第5章 市場區隔
- 形式
- 胺基酸
- 富裡酸
- 腐植酸
- 蛋白質水解物
- 海藻萃取物
- 其他生物刺激素
- 作物類型
- 經濟作物
- 園藝作物
- 田間作物
- 地區
- 非洲
- 按國家
- 埃及
- 奈及利亞
- 南非
- 非洲其他地區
- 亞太地區
- 按國家
- 澳洲
- 中國
- 印度
- 印尼
- 日本
- 菲律賓
- 泰國
- 越南
- 其他亞太地區
- 歐洲
- 按國家
- 法國
- 德國
- 義大利
- 荷蘭
- 俄羅斯
- 西班牙
- 土耳其
- 英國
- 其他歐洲國家
- 中東
- 按國家
- 伊朗
- 沙烏地阿拉伯
- 其他中東地區
- 北美洲
- 按國家
- 加拿大
- 墨西哥
- 美國
- 北美其他地區
- 南美洲
- 按國家
- 阿根廷
- 巴西
- 南美洲其他地區
- 非洲
第6章 競爭格局
- 主要策略趨勢
- 市場佔有率分析
- 業務狀況
- 公司簡介.
- Agriculture Solutions Inc.
- Agrinos
- Atlantica Agricola
- Biolchim SpA
- Bionema
- Coromandel International Ltd
- Haifa Group
- Koppert Biological Systems Inc.
- Plant Response Biotech Inc.
- Sigma Agriscience LLC
- T Stanes and Company Limited
- Trade Corporation International
- UPL
- Valagro
- Vittia Group
第7章:執行長的關鍵策略問題
第 8 章 附錄
- 世界概況
- 概述
- 五力分析框架
- 全球價值鏈分析
- 市場動態(DRO)
- 資訊來源和進一步閱讀
- 圖片列表
- 關鍵見解
- 資料包
- 詞彙表
簡介目錄
Product Code: 49202
The Biostimulants Market size is estimated at 4.46 billion USD in 2025, and is expected to reach 7.29 billion USD by 2030, growing at a CAGR of 10.32% during the forecast period (2025-2030).
- The use of biostimulants in agriculture has gained momentum in recent years, with increasing awareness among farmers about the benefits of these products on crop growth and yield. Biostimulants are natural or synthetic substances that enhance plant growth and improve nutrient uptake, stress tolerance, and overall health.
- Amino acids emerged as the most consumed biostimulants globally, with a market share of 32.0% in 2022. This high share was primarily due to the positive effects of amino acids on crops when applied, such as increasing seed yield and grain numbers per ear in winter wheat crops in European countries. The consumption of biostimulants was the highest in row crops, which accounted for 74.6% of the market share in 2022, followed by horticultural crops and cash crops.
- Europe dominated the biostimulants segment, with a market share of 40.6% in 2022, followed by North America and Asia-Pacific. This high share was due to the high awareness among farmers in the region and the government's promotion of organic agriculture, with a target of 25.0% of agricultural land to be organic by 2030.
- The biostimulants segment is expected to record a CAGR of 10.1% between 2023 and 2029, driven by the increasing demand for organic products and the growing area under the cultivation of organic crops.
- Biostimulants have gained popularity in the agricultural industry to reduce the use of chemical fertilizers and pesticides. The organic food industry, which is growing at a healthy rate, is another major driving force behind the growth of the biostimulant market.
- Europe is the largest market for global biostimulants, accounting for 40.6% of the market value, valued at USD 1.3 billion, in 2022. The European Commission has set a target for member countries to bring 25% of their respective agricultural land under organic farming, reinforcing Europe's key priorities for smart growth and innovation for the bio-based economy. Biostimulants represent a critical ingredient for the same. Germany plays a lead role in achieving these objectives by investing in R&D to enhance the effectiveness of biostimulants.
- North America is the second-largest market for global biostimulants, with a market value of USD 840.2 million in 2022. Countries in the region are introducing policies to increase organic farming, such as the USDA's Organic Transition Initiative in the United States, with an investment of USD 300 million in 2022. This initiative aims to provide financial assistance to farmers and encourage farmer-to-farmer mentoring, including creating awareness of the beneficial impacts of biostimulants.
- The Asia-Pacific region holds the third-largest position in the biostimulants market, with China, the world's largest fertilizer consumer, already using organic inputs for crop production. Similarly, South America and Africa have also witnessed a flux in the biostimulants market due to increased awareness among growers. The reduced usage of chemical inputs and increasing global organic area are projected to drive the biostimulants market at a CAGR of 10.1% during the forecast period.
Global Biostimulants Market Trends
The increasing awareness and Government initiatives is driving the organic production in North America and Europe.
- Organic agriculture has emerged as a significant contributor to sustainable food systems, with 187 countries practicing it globally. As of 2021, there are 72.3 million hectares of organic agricultural land globally, with an average increase of 2.9% across all regions from 2018 to 2021. Among these, organic arable land accounted for 14.4 million hectares in 2021, representing 19.9% of the total organic agricultural land. The strongest markets for organic farming are in North America and Europe, accounting for 41.0% of the global organic arable land in 2022. The total organic arable land in Europe was 6.5 million hectares in 2022, equivalent to 44.1% of the overall organic arable agricultural area. The most significant crops grown organically in North America and Europe are apples, strawberries, cereals, and olives, among others.
- Developing countries in the Asia-Pacific region are also joining the organic agriculture movement and becoming self-sufficient in producing and providing fresh organic produce to meet domestic demand. The Asia-Pacific region observed an increasing trend in organic farming, with an 18.8% increase in organic arable land from 2017 to 2022. The major initiatives by governments in the region have also played a vital role in boosting organic farming. For example, Japan's Basic Plan for Agriculture and Management in 2021 aims to triple the number of organic farmers and organic lands by 2030.
- Organic agriculture is becoming increasingly popular globally, with various countries adopting it to achieve sustainable food systems. The growth in organic agriculture is driven by the increasing awareness about the benefits of organic farming, such as promoting soil health, reducing environmental impacts, and producing healthier food.
Per capita spending of organic food majorly observed in United States and Germany, attributed to the consumer demand for healthier and sustainable food
- The organic food market has experienced significant growth over the past decade, with global sales reaching USD 120.6 billion in 2020, up from USD 70.8 billion in 2012. The trend toward organic food is driven by several factors, including increasing consumer demand for healthier, more sustainable food options and growing awareness about the environmental impact of conventional agriculture.
- According to a survey conducted by the Organic Trade Association, in 2021, sales of organic fruits and vegetables increased by around 4.5% that year, accounting for 15% of the overall organic sales. North America currently dominates the market in terms of average spending on organic products, with per capita spending in the United States reaching USD 186.7 in 2021, the highest among North American countries. Europe is also expected to experience significant growth in the organic market, with Germany accounting for the highest per capita spending of USD 75.6 during the same year.
- While the organic food market is still dominated by developed countries with high levels of disposable income, it is also expected to grow in developing nations. For example, in the Asia-Pacific region, the increase in the number of working-class people is likely to contribute to market expansion. As the availability of organic products increases, prices become more affordable.
- The organic food market is experiencing significant growth globally and is expected to continue during the forecast period.
Biostimulants Industry Overview
The Biostimulants Market is fragmented, with the top five companies occupying 11.95%. The major players in this market are Biolchim SpA, Coromandel International Ltd, Koppert Biological Systems Inc., Trade Corporation International and Valagro (sorted alphabetically).
Additional Benefits:
- The market estimate (ME) sheet in Excel format
- 3 months of analyst support
TABLE OF CONTENTS
1 EXECUTIVE SUMMARY & KEY FINDINGS
2 REPORT OFFERS
3 INTRODUCTION
- 3.1 Study Assumptions & Market Definition
- 3.2 Scope of the Study
- 3.3 Research Methodology
4 KEY INDUSTRY TRENDS
- 4.1 Area Under Organic Cultivation
- 4.2 Per Capita Spending On Organic Products
- 4.3 Regulatory Framework
- 4.3.1 Argentina
- 4.3.2 Australia
- 4.3.3 Brazil
- 4.3.4 Canada
- 4.3.5 China
- 4.3.6 Egypt
- 4.3.7 France
- 4.3.8 Germany
- 4.3.9 India
- 4.3.10 Indonesia
- 4.3.11 Italy
- 4.3.12 Japan
- 4.3.13 Mexico
- 4.3.14 Netherlands
- 4.3.15 Nigeria
- 4.3.16 Philippines
- 4.3.17 Russia
- 4.3.18 South Africa
- 4.3.19 Spain
- 4.3.20 Thailand
- 4.3.21 Turkey
- 4.3.22 United Kingdom
- 4.3.23 United States
- 4.3.24 Vietnam
- 4.4 Value Chain & Distribution Channel Analysis
5 MARKET SEGMENTATION (includes market size in Value in USD and Volume, Forecasts up to 2030 and analysis of growth prospects)
- 5.1 Form
- 5.1.1 Amino Acids
- 5.1.2 Fulvic Acid
- 5.1.3 Humic Acid
- 5.1.4 Protein Hydrolysates
- 5.1.5 Seaweed Extracts
- 5.1.6 Other Biostimulants
- 5.2 Crop Type
- 5.2.1 Cash Crops
- 5.2.2 Horticultural Crops
- 5.2.3 Row Crops
- 5.3 Region
- 5.3.1 Africa
- 5.3.1.1 By Country
- 5.3.1.1.1 Egypt
- 5.3.1.1.2 Nigeria
- 5.3.1.1.3 South Africa
- 5.3.1.1.4 Rest of Africa
- 5.3.2 Asia-Pacific
- 5.3.2.1 By Country
- 5.3.2.1.1 Australia
- 5.3.2.1.2 China
- 5.3.2.1.3 India
- 5.3.2.1.4 Indonesia
- 5.3.2.1.5 Japan
- 5.3.2.1.6 Philippines
- 5.3.2.1.7 Thailand
- 5.3.2.1.8 Vietnam
- 5.3.2.1.9 Rest of Asia-Pacific
- 5.3.3 Europe
- 5.3.3.1 By Country
- 5.3.3.1.1 France
- 5.3.3.1.2 Germany
- 5.3.3.1.3 Italy
- 5.3.3.1.4 Netherlands
- 5.3.3.1.5 Russia
- 5.3.3.1.6 Spain
- 5.3.3.1.7 Turkey
- 5.3.3.1.8 United Kingdom
- 5.3.3.1.9 Rest of Europe
- 5.3.4 Middle East
- 5.3.4.1 By Country
- 5.3.4.1.1 Iran
- 5.3.4.1.2 Saudi Arabia
- 5.3.4.1.3 Rest of Middle East
- 5.3.5 North America
- 5.3.5.1 By Country
- 5.3.5.1.1 Canada
- 5.3.5.1.2 Mexico
- 5.3.5.1.3 United States
- 5.3.5.1.4 Rest of North America
- 5.3.6 South America
- 5.3.6.1 By Country
- 5.3.6.1.1 Argentina
- 5.3.6.1.2 Brazil
- 5.3.6.1.3 Rest of South America
- 5.3.1 Africa
6 COMPETITIVE LANDSCAPE
- 6.1 Key Strategic Moves
- 6.2 Market Share Analysis
- 6.3 Company Landscape
- 6.4 Company Profiles (includes Global Level Overview, Market Level Overview, Core Business Segments, Financials, Headcount, Key Information, Market Rank, Market Share, Products and Services, and Analysis of Recent Developments).
- 6.4.1 Agriculture Solutions Inc.
- 6.4.2 Agrinos
- 6.4.3 Atlantica Agricola
- 6.4.4 Biolchim SpA
- 6.4.5 Bionema
- 6.4.6 Coromandel International Ltd
- 6.4.7 Haifa Group
- 6.4.8 Koppert Biological Systems Inc.
- 6.4.9 Plant Response Biotech Inc.
- 6.4.10 Sigma Agriscience LLC
- 6.4.11 T Stanes and Company Limited
- 6.4.12 Trade Corporation International
- 6.4.13 UPL
- 6.4.14 Valagro
- 6.4.15 Vittia Group
7 KEY STRATEGIC QUESTIONS FOR AGRICULTURAL BIOLOGICALS CEOS
8 APPENDIX
- 8.1 Global Overview
- 8.1.1 Overview
- 8.1.2 Porter's Five Forces Framework
- 8.1.3 Global Value Chain Analysis
- 8.1.4 Market Dynamics (DROs)
- 8.2 Sources & References
- 8.3 List of Tables & Figures
- 8.4 Primary Insights
- 8.5 Data Pack
- 8.6 Glossary of Terms
02-2729-4219
+886-2-2729-4219
 全球生物刺激素市場 - 2025 至 2032 年
 亞太生物刺激素:市場佔有率分析、產業趨勢與成長預測(2025-2030 年)北美生物刺激素:市場佔有率分析、產業趨勢與成長預測(2025-2030 年)南美生物刺激素:市場佔有率分析、產業趨勢與成長預測(2025-2030 年)美國生物刺激素市場:市場佔有率分析、產業趨勢與成長預測(2025-2030 年)非洲生物刺激素:市場佔有率分析、產業趨勢與成長預測(2025-2030 年)
 2025年生物刺激素全球市場報告腐植酸生物刺激素全球市場報告 2025
 2025-2033 年按產品類型、作物類型、形式、原產地、配銷通路、應用、最終用戶和地區分類的生物促效劑市場報告
 生物刺激素市場規模、佔有率、成長分析,按活性成分、作物類型、應用、地區 - 產業預測,2024-2031
▼