


 |
市場調查報告書
商品編碼
1685890
非洲生物刺激素:市場佔有率分析、產業趨勢與成長預測(2025-2030 年)Africa Biostimulants - Market Share Analysis, Industry Trends & Statistics, Growth Forecasts (2025 - 2030) |
||||||
※ 本網頁內容可能與最新版本有所差異。詳細情況請與我們聯繫。
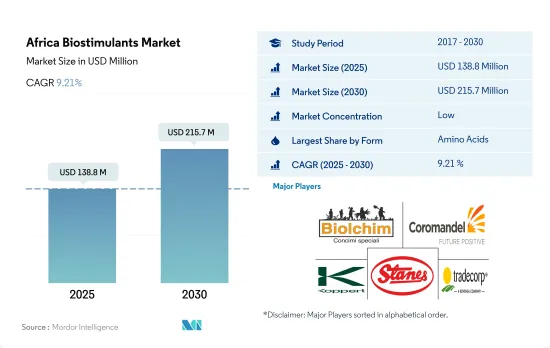
預計 2025 年非洲生物刺激素市場規模為 1.388 億美元,到 2030 年將達到 2.157 億美元,預測期內(2025-2030 年)的複合年成長率為 9.21%。
- 胺基酸類生物刺激素將主導非洲市場,2022 年價值 3,530 萬美元。胺基酸類生物刺激素被廣泛應用,因為它們能夠促進種子發芽和幼苗生長,提高作物對各種生物和生物脅迫的適應性,增強養分的吸收和利用,特別是氮和磷,並提高農藥和化肥等其他農業投入的效率。
- 腐殖酸基生物刺激素可能推動市場發展,因為它具有抗逆性增強、養分吸收增加、化學投入總體減少,以及易於透過灌溉和土壤噴灑施用等優勢,預計到 2029 年將成長約 78.5%,達到 4,960 萬美元。
- 腐植酸基生物刺激素是一種有機土壤改良劑,來自土壤、泥炭、煤炭和其他化石礦床中的腐植質,可促進土壤健康和植物生長。富含腐植酸。這些生物刺激素佔2022年非洲生物刺激素市場以金額為準的23.4%,是第二大市場佔有率。
- 由於海藻萃取物類生物刺激素在許多沿海地區供應充足,且能夠減少農業對化學肥料的需求,因此有潛力增加市場佔有率。這些因素可能會在預測期內推動對海藻基生物刺激素的需求。 2022 年,以海藻萃取物為基礎的生物刺激素的銷售額約為 2,310 萬美元。
- 預計 2023 年至 2029 年間,腐植酸和富裡酸基生物刺激素的成長速度將超過其他生物刺激素。
- 非洲以其多樣化的農業系統而聞名,全部區域種植著各種各樣的作物。農業在非洲經濟中發揮關鍵作用,2021年作物農業種植面積已成長至約12萬公頃。玉米、小麥和玉米等穀類是該地區種植最廣泛的作物。
- 非洲農業的成長領域之一是生物刺激素市場,其價值顯著成長,從 2017 年到 2021 年成長了約 18.7%。預計這種成長將持續下去,市值預計將成長 67.8%。
- 非洲其他地區將佔據非洲生物刺激素市場的大部分佔有率,到 2022 年將佔市場佔有率的約 81.1%。以面積計算,突尼斯是最大的有機生產國,而衣索比亞在 2020 年擁有最多的有機生產國,約 22 萬家。然而,大多數非洲國家缺乏有機農業立法,阻礙了某些地區建立成熟的生物刺激素市場。
- 至2022年,海藻基生物刺激素將佔市場佔有率的43.8%,價值約340萬美元。在奈及利亞,海藻萃取物基生物刺激素的使用十分廣泛。
- 由於國內外消費者對有機產品的興趣日益濃厚,預計未來幾年非洲對生物刺激素的需求將會成長。農民越來越了解過度依賴化學投入的弊端以及使用生物刺激素的經濟效益。由於這些因素,非洲生物刺激素市場有望大幅成長,並為該地區的農民和企業提供機會。
非洲生物刺激素市場趨勢
該地區的有機產業擁有 834,000 個有機生產商,突尼斯擁有更多的有機農地。
- 2022年,非洲地區有機農地面積超過120萬公頃,佔全球有機農地面積的9.0%。
- 2020 年,非洲有機種植面積比 2019 年增加 149,000 公頃,與前一年同期比較增 7.7%,生產者約 834,000 家。突尼斯擁有最多的有機土地(2020 年超過 29 萬公頃),衣索比亞擁有最多的有機生產者(約 22 萬人)。島國聖多美和普林西比是該地區投入有機農業土地最多的國家,其農業面積的20.7%為有機作物。
- 在非洲,經濟作物在有機農地中所佔比例大,佔有機農地總面積的63.2%,達81.74萬公頃。田間作物佔非洲有機農地面積的第二大佔有率,約佔有機土地總面積的25.6%,總合331,200公頃。至2022年,園藝作物將佔非洲有機農地總面積的11.2%,達144,900公頃。
- 有機農地面積較大的非洲國家包括非洲其他地區、埃及和南非。到 2022 年,非洲其他地區將佔非洲有機農業總面積的 95.0%,達到 120 萬公頃,其次是埃及,為 45,100 公頃,佔 3.5%,南非為 12,600 公頃,佔 1.0%。
- 在非洲,2017年至2022年間,有機農業面積增加了6.9%。預計到2029年將成長約52.2%,達到200萬美元。
埃及、南非和奈及利亞是有機產品人均支出最高的國家
- 多年來,非洲的人均收入一直在持續成長,導致人們在營養食品上的支出增加。非洲各地的貨架上有機食品和飲料越來越常見。經過認證的有機農產品的國內消費量相對較低,因此大多數有機產品都用於出口。
- 在非洲,有機產品的消費量顯著增加,尤其是在埃及、南非和奈及利亞。 2021年,埃及的人均有機產品消費量為55.5美元,其次是南非,為7.1美元。有機生產者數量最多的國家是衣索比亞(近 222,000 家)、坦尚尼亞(近 149,000 家)和烏干達(超過 139,000 家)。
- 非洲地區普遍消費的有機產品包括新鮮蔬菜和水果。在非洲,人們做出了巨大努力,將有機農業納入政策、國家推廣體系、行銷和價值鏈發展的主流。所有這些因素都引起了消費者的興趣。
- 預計 2023 年至 2029 年間,非洲對有機食品的需求將會擴大,這得益於人均飲料消費量(尤其是果汁)的增加、健康意識的增強以及消費者轉向無化學成分的有機飲料和食品。
- 然而,低收入人口以及缺乏有機標準和其他當地市場認證基礎設施是該地區有機市場成長的主要阻礙因素。
非洲生物刺激素產業概況
非洲生物刺激素市場較為分散,前五大企業佔18.64%。市場的主要企業有:Biolchim SPA、Coromandel International Ltd、Koppert Biological Systems Inc.、T. Stanes and Company Limited 和 Trade Corporation International(按字母順序排列)。
其他福利
- Excel 格式的市場預測 (ME) 表
- 3個月的分析師支持
目錄
第1章執行摘要和主要發現
第2章 報告要約
第3章 引言
- 研究假設和市場定義
- 研究範圍
- 調查方法
第4章 產業主要趨勢
- 有機種植區
- 有機產品人均支出
- 法律規範
- 埃及
- 奈及利亞
- 南非
- 價值鍊和通路分析
第5章市場區隔
- 形式
- 胺基酸
- 富裡酸
- 腐植酸
- 蛋白質水解物
- 海藻萃取物
- 其他生物刺激素
- 作物類型
- 經濟作物
- 園藝作物
- 田間作物
- 原產地
- 埃及
- 奈及利亞
- 南非
- 其他非洲國家
第6章競爭格局
- 關鍵策略趨勢
- 市場佔有率分析
- 商業狀況
- 公司簡介.
- Atlantica Agricola
- Biolchim SPA
- Coromandel International Ltd
- Haifa Group
- Humic Growth Solutions Inc.
- Koppert Biological Systems Inc.
- Microbial Biological Fertilizers International
- T. Stanes and Company Limited
- Trade Corporation International
- UPL
第7章:CEO面臨的關鍵策略問題
第 8 章 附錄
- 世界概況
- 概述
- 五力分析框架
- 全球價值鏈分析
- 市場動態(DRO)
- 資訊來源及延伸閱讀
- 圖片列表
- 關鍵見解
- 資料包
- 詞彙表
The Africa Biostimulants Market size is estimated at 138.8 million USD in 2025, and is expected to reach 215.7 million USD by 2030, growing at a CAGR of 9.21% during the forecast period (2025-2030).
- Amino acid-based biostimulants dominate the African market, valued at USD 35.3 million in 2022. Amino acid-based biostimulants are widely used because of their ability to enhance seed germination and seedling growth, improve crop resilience to various biotic and abiotic stresses, boost nutrient uptake and utilization, especially with regard to nitrogen and phosphorus, and amplify the efficiency of other agricultural inputs such as pesticides and fertilizers.
- The benefits of humic acid-based biostimulants, such as increased stress tolerance, increased nutrient uptake, and an overall reduction in chemical inputs, as well as their ease of application via fertigation or soil application methods, may drive the market, with the market value expected to grow by about 78.5% to USD 49.6 million by 2029.
- Humic acid-based biostimulants, which are a type of organic soil amendment derived from humic substances found in soil, peat, coal, and other fossil deposits, are known to enhance soil health and plant growth. They are rich in humic acids. These biostimulants account for the second-largest market share, representing 23.4% of the African biostimulant market by value in 2022.
- Seaweed extract-based biostimulants can potentially improve their market share in the African region due to their abundant availability in many coastal areas and their ability to decrease the need for chemical fertilizers in agriculture. These factors may drive the demand for seaweed-based biostimulants during the forecast period. Seaweed extract-based biostimulants accounted for about USD 23.1 million in 2022.
- Humic and fulvic acid-based biostimulants are anticipated to grow faster than other biostimulants between 2023 and 2029.
- Africa is known for its diverse agricultural systems, with a wide range of crops grown across the region. Agriculture plays a vital role in the African economy, and organic farming gained traction, with approximately 120 thousand hectares of organic crop area in 2021. Cereal crops, such as maize, wheat, and corn, are among the most widely grown crops in the region.
- One area of growth in African agriculture is the biostimulants market, which saw a significant increase in value, rising by approximately 18.7% from 2017 to 2021. This growth is expected to continue, with the market value projected to increase by 67.8%.
- The majority of the African biostimulants market is dominated by the Rest of African region, accounting for about 81.1% of the market value in 2022. Tunisia is the top organic producer in terms of area, and Ethiopia has the highest number of organic producers, with approximately 220,000 in 2020. However, the lack of legislation for organic farming in most African countries has hampered the establishment of a well-established biostimulant market in some areas.
- Seaweed-based biostimulants make up 43.8% of the market value, valued at about USD 3.4 million in 2022. The use of seaweed extract-based biostimulants is prevalent in Nigeria.
- The demand for biostimulants in Africa is expected to rise in the coming years, driven by increasing consumer interest in organic products, both domestically and internationally. Farmers are becoming more informed about the drawbacks of heavy reliance on chemical inputs and the economic benefits of using biostimulants. With these factors in play, the biostimulants market in Africa is poised for significant growth, providing opportunities for both farmers and businesses in the region.
Africa Biostimulants Market Trends
8,34,000 organic producers are in the region's organic sector with Tunisia is having more organic land
- In 2022, the area of organic agricultural land in the African region amounted to over 1.2 million hectares, representing 9.0% of the global organic agricultural area.
- In 2020, Africa reported 149,000 hectares more in organic cultivation land than in 2019, recording a 7.7% increase Y-o-Y in line with the presence of nearly 834,000 producers. Tunisia had the largest amount of organic land (more than 290,000 hectares in 2020), whereas Ethiopia had the highest number of organic producers (almost 220,000). The island states of Sao Tome and Principe have the most significant amount of land committed to organic farming in the region, with 20.7% of their agricultural area dedicated to organic crops.
- In the African region, cash crops account for a significant share of organic agricultural land, amounting to 63.2% of the total organic acreage with 817.4 thousand hectares. Row crops hold the second-largest share of organic acreage in Africa, which amounts to about 25.6% of the total organic acreage, totaling 331.2 thousand hectares. Horticultural crops account for 11.2% of the total organic acreage in Africa, with 144.9 thousand hectares in 2022.
- The African countries with significant organic agricultural acreage include the Rest of Africa regional segment, Egypt, and South Africa. In 2022, the Rest of Africa segment accounted for 95.0% of the total organic agricultural acreage in Africa, with 1.2 million hectares, Egypt accounted for a 3.5% share with 45.1 thousand hectares, and South Africa accounted for a 1.0% share with 12.6 thousand hectares.
- Organic agricultural acreage rose by 6.9% between 2017 and 2022 in Africa. It is anticipated to increase by about 52.2% and reach USD 2.0 million by 2029.
Per capita spending on organic product predominant in Egypt, South Africa, and Nigeria countries
- Africa's per capita income has consistently increased throughout the years, encouraging people to spend more money on nutritious food. Organic foods and beverages are gaining more shelf space in the African region. Since the domestic consumption of certified organic produce is relatively small, most organic goods are produced for export.
- In Africa, consumption of organic products has increased significantly, especially in Egypt, South Africa, and Nigeria. In 2021, the per capita consumption of organic products was USD 55.5 in Egypt, followed by South Africa with USD 7.1. The countries with the highest number of organic producers were Ethiopia (almost 222,000), Tanzania (nearly 149,000), and Uganda (over 139,000).
- In the African region, commonly consumed organic products include fresh vegetables and fruits. In Africa, significant efforts have been made to mainstream organic agriculture into policy, national extension systems, marketing, and value chain development. All these factors have gained the attention of consumers.
- With the increasing per capita consumption of beverages, primarily fruit juices, growing health awareness, and consumers shifting toward organic drinks and food that do not contain chemical ingredients, the demand for the African organic food market is expected to grow between 2023 and 2029.
- However, low-income levels and a lack of organic standards and other infrastructure for local market certification are the major restraining factors for the growth of the organic market in the region.
Africa Biostimulants Industry Overview
The Africa Biostimulants Market is fragmented, with the top five companies occupying 18.64%. The major players in this market are Biolchim SPA, Coromandel International Ltd, Koppert Biological Systems Inc., T. Stanes and Company Limited and Trade Corporation International (sorted alphabetically).
Additional Benefits:
- The market estimate (ME) sheet in Excel format
- 3 months of analyst support
TABLE OF CONTENTS
1 EXECUTIVE SUMMARY & KEY FINDINGS
2 REPORT OFFERS
3 INTRODUCTION
- 3.1 Study Assumptions & Market Definition
- 3.2 Scope of the Study
- 3.3 Research Methodology
4 KEY INDUSTRY TRENDS
- 4.1 Area Under Organic Cultivation
- 4.2 Per Capita Spending On Organic Products
- 4.3 Regulatory Framework
- 4.3.1 Egypt
- 4.3.2 Nigeria
- 4.3.3 South Africa
- 4.4 Value Chain & Distribution Channel Analysis
5 MARKET SEGMENTATION (includes market size in Value in USD and Volume, Forecasts up to 2030 and analysis of growth prospects)
- 5.1 Form
- 5.1.1 Amino Acids
- 5.1.2 Fulvic Acid
- 5.1.3 Humic Acid
- 5.1.4 Protein Hydrolysates
- 5.1.5 Seaweed Extracts
- 5.1.6 Other Biostimulants
- 5.2 Crop Type
- 5.2.1 Cash Crops
- 5.2.2 Horticultural Crops
- 5.2.3 Row Crops
- 5.3 Country
- 5.3.1 Egypt
- 5.3.2 Nigeria
- 5.3.3 South Africa
- 5.3.4 Rest of Africa
6 COMPETITIVE LANDSCAPE
- 6.1 Key Strategic Moves
- 6.2 Market Share Analysis
- 6.3 Company Landscape
- 6.4 Company Profiles (includes Global Level Overview, Market Level Overview, Core Business Segments, Financials, Headcount, Key Information, Market Rank, Market Share, Products and Services, and Analysis of Recent Developments).
- 6.4.1 Atlantica Agricola
- 6.4.2 Biolchim SPA
- 6.4.3 Coromandel International Ltd
- 6.4.4 Haifa Group
- 6.4.5 Humic Growth Solutions Inc.
- 6.4.6 Koppert Biological Systems Inc.
- 6.4.7 Microbial Biological Fertilizers International
- 6.4.8 T. Stanes and Company Limited
- 6.4.9 Trade Corporation International
- 6.4.10 UPL
7 KEY STRATEGIC QUESTIONS FOR AGRICULTURAL BIOLOGICALS CEOS
8 APPENDIX
- 8.1 Global Overview
- 8.1.1 Overview
- 8.1.2 Porter's Five Forces Framework
- 8.1.3 Global Value Chain Analysis
- 8.1.4 Market Dynamics (DROs)
- 8.2 Sources & References
- 8.3 List of Tables & Figures
- 8.4 Primary Insights
- 8.5 Data Pack
- 8.6 Glossary of Terms
 全球生物刺激素市場 - 2025 至 2032 年
 亞太生物刺激素:市場佔有率分析、產業趨勢與成長預測(2025-2030 年)
 北美生物刺激素:市場佔有率分析、產業趨勢與成長預測(2025-2030 年)
 南美生物刺激素:市場佔有率分析、產業趨勢與成長預測(2025-2030 年)
 生物刺激素:市場佔有率分析、產業趨勢與統計、成長預測(2025-2030 年)
 美國生物刺激素市場:市場佔有率分析、產業趨勢與成長預測(2025-2030 年)
 2025年生物刺激素全球市場報告
 腐植酸生物刺激素全球市場報告 2025
 2025-2033 年按產品類型、作物類型、形式、原產地、配銷通路、應用、最終用戶和地區分類的生物促效劑市場報告
 生物刺激素市場規模、佔有率、成長分析,按活性成分、作物類型、應用、地區 - 產業預測,2024-2031