


 |
市場調查報告書
商品編碼
1538920
組織植物蛋白市場,按產品類型、最終用戶分類,格式:全球機會分析和產業預測,2024-2035 年Textured Vegetable Protein Market By PRODUCT TYPE (Textured soy protein, Others), By END USER (Business to Business, Business to consumer), By FORM (Granules, Flakes, Chunks, Others): Global Opportunity Analysis and Industry Forecast, 2024-2035 |
||||||
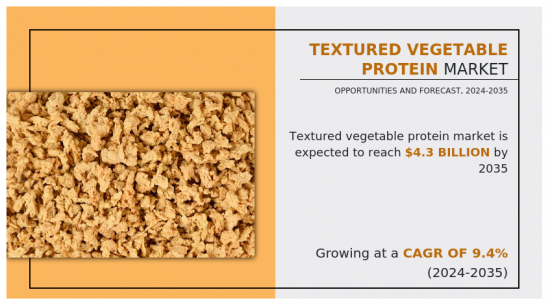
2023年,紋理植物蛋白市場規模為15億美元,預計2024年至2035年複合年成長率為9.4%,到2035年將達到43億美元。
組織化植物性蛋白質是一種源自豌豆、大豆、小麥等的植物性蛋白質。它是肉類替代品,含有高蛋白質和膳食纖維,不含脂肪或膽固醇。組織化植物性蛋白質是一種經過加工、乾燥、耐儲存的產品,有多種形式,如顆粒、薄片和塊狀。市面上有不同種類的組織化植物蛋白,例如組織化小麥蛋白、組織化豆類蛋白、組織化大豆蛋白。
市場吸引力極大地推動了組織化植物蛋白市場的需求。隨著消費者對價格越來越敏感並需要負擔得起的蛋白質選擇,紋理植物蛋白因其在動物蛋白質中相對較低的成本而成為一種有吸引力的選擇。這種實惠性使其適合廣泛的受眾,包括精打細算的消費者、家庭和食品製造商,他們希望在不影響品質或營養價值的情況下最佳化生產成本。此外,組織化植物蛋白的成本效益超出了零售價格,並為整個食品供應鏈提供了經濟效益。與新鮮肉類相比,其保存期限更長,減少了食品廢棄物和儲存成本,使其成為消費者和零售商的明智選擇。
此外,組織化植物蛋白的多功能性使其能夠在各種食品中進行廣泛的烹飪應用,從而具有成本效益。從肉類替代品到零食、穀物和烘焙產品,組織化植物蛋白正在被納入各種食譜中,為傳統肉類菜餚創造出一種經濟實惠且營養豐富的替代品。這種多功能性擴大了市場潛力,為食品製造商提供了產品創新和差異化的機會,並提高了消費者的興趣和忠誠度。此外,隨著全球對植物蛋白替代品的需求持續成長,組織化植物蛋白生產的規模經濟將進一步降低成本,並使其成為未來更具成本效益的選擇。因此,所有這些因素都在推動對紋理植物蛋白市場的需求。
供應鏈脆弱性是組織化植物性蛋白質市場需求的主要限制因素。組織化植物蛋白的生產高度依賴穩定可靠的原料供應,主要是大豆和其他植物性蛋白質。然而,全球農業供應鏈容易受到各種干擾,包括惡劣天氣條件、作物產量波動和地緣政治衝突。這些供應鏈漏洞通常會導致原料短缺和供應波動,從而導致生產延遲並增加組織化植物蛋白製造商的成本。此外,對有限供應商和地區採購原料的依賴加劇了供應鏈風險,進一步影響了對紋理植物蛋白市場的需求。
隨著消費者偏好更健康、更永續的食品選擇,餐廳、咖啡館和機構餐飲服務等食品服務業擴大將植物性食品納入其菜單中,這種成長為紋理植物蛋白市場提供了眾多機會。紋理植物蛋白正在成為廚師和食品服務者尋求滿足對植物蛋白替代品快速成長的需求的多功能解決方案。它的適應性使其可以無縫地應用於從漢堡和塔可餅到炒菜和沙拉的無數菜餚中。此外,有組織的植物蛋白使餐廳能夠使其菜單多樣化,並吸引不斷成長的消費者群,包括素食者、素食主義者和注重健康的個人,從而滿足市場需求,從而增強競爭力。
此外,食品服務業為組織化植物蛋白製造商提供了一個平台,展示其產品的烹飪潛力並與行業相關人員合作。透過與廚師和食品經銷商合作,紋理植物蛋白供應商可以開發創新的食譜和菜單概念,突出您可以共同創造的紋理植物蛋白菜餚的風味、質地和營養價值。因此,所有這些因素都為組織化植物蛋白市場創造了許多機會。
組織化植物蛋白市場分為類型、形式、最終用戶和地區。按類型分類,市場分為組織大豆蛋白和其他。依形態可分為片狀、顆粒狀、塊狀等。依最終用戶分類,市場分為B2B和B2C。依地區分類,北美(美國、加拿大、墨西哥)、歐洲(英國、德國、法國、義大利、西班牙其他歐洲國家地區)、亞太地區(中國、印度、日本、韓國等亞太地區) )、拉丁美洲((巴西、阿根廷、哥倫比亞、拉丁美洲其他地區)、非洲-中東(海灣合作理事會、南非、非洲其他地區-中東)。
相關人員的主要利益
- 本報告定量分析了 2023 年至 2035 年紋理植物蛋白市場的細分市場、當前趨勢、估計/趨勢和動態,並確定了馬蘇紋理植物蛋白市場的主要市場機會。
- 我們提供市場研究以及與市場促進因素、市場限制和市場機會相關的資訊。
- 波特的五力分析強調買家和供應商幫助相關人員做出利潤驅動的商業決策並加強供應商-買家網路的潛力。
- 紋理植物蛋白市場細分的詳細分析將有助於確定市場機會。
- 每個地區的主要國家都根據其對全球市場的收益貢獻繪製了地圖。
- 市場參與者定位有助於基準化分析,並提供對市場參與者當前位置的清晰了解。
- 該報告包括對區域和全球紋理植物蛋白市場趨勢、主要企業、細分市場、應用領域和市場成長策略的分析。
可以使用此報告進行客製化(需要額外費用和時間表)
- 消費者偏好和產品規格
- 按產品/細分市場分類的參與者的市場佔有率分析
- 根據客戶興趣加入公司簡介
- 公司簡介的擴充列表
- 主要參與者的詳細資料(Excel格式,包括位置、聯絡資訊、供應商/供應商網路等)
- SWOT分析
目錄
第1章 簡介
第 2 章執行摘要
第3章市場概況
- 市場定義和範圍
- 主要發現
- 影響因素
- 主要投資機會
- 波特五力分析
- 市場動態
- 促進因素
- 抑制因素
- 機會
第4章組織植物性蛋白質市場:依產品類型
- 概述
- 大豆組織蛋白
- 其他
第5章 組織化植物性蛋白質市場:依最終使用者分類
- 概述
- 企業對企業
- 企業對消費者
第6章 組織化植物性蛋白質市場:依形式
- 概述
- 顆粒
- 薄片
- 區塊
- 其他
第7章 組織化植物性蛋白質市場:依地區
- 概述
- 北美洲
- 美國
- 加拿大
- 墨西哥
- 歐洲
- 英國
- 德國
- 法國
- 義大利
- 西班牙
- 其他
- 亞太地區
- 中國
- 印度
- 日本
- 韓國
- 其他
- 拉丁美洲
- 巴西
- 阿根廷
- 哥倫比亞
- 其他拉丁美洲
- 中東/非洲
- Gcc
- 南非
- 其他中東和非洲
第8章 競爭格局
- 介紹
- 關鍵成功策略
- 10家主要企業產品圖譜
- 競爭對手儀表板
- 競爭熱圖
- 主要企業定位(2023年)
第9章 公司簡介
- Archer Daniels Midland Company
- Cargill Incorporated Inc.
- Du Pont de Nemours and Company
- Foodchem International Corporation
- Hung Yang Foods Co., Ltd
- Sonic Biochem Extraction Pvt Ltd
- Sudzucker Group(Beneo)
- Victoria Group AD
- Wilmar International Limited
The textured vegetable protein market size was valued at $1.5 billion in 2023 and is projected to reach $4.3 billion by 2035, growing at a CAGR of 9.4% from 2024 to 2035.
Textured vegetable protein is a plant-based protein specifically derived from pea, soyabean, wheat, and others. It is a meat substitute and has high protein and fiber content, while having zero fat or cholesterol. The textured vegetable protein is dry and shelf-stable product after processing and is available in different forms including granules, flakes, chunks, and others. Different variants of textured vegetable proteins are available in the market such as textured wheat protein, textured pea protein, textured soy protein and others.
Cost-effectiveness significantly drives the demand for textured vegetable protein market as consumers become increasingly price-conscious and seek affordable protein options, textured vegetable protein emerges as an attractive choice due to its relatively lower cost compared to animal-derived proteins. This affordability makes it accessible to a broader demographic, including budget-conscious consumers, families, and food manufacturers those who look to optimize production costs without compromising on quality or nutritional value. Moreover, the cost-effectiveness of textured vegetable protein extends beyond its retail price, as it offers economic benefits throughout the food supply chain. Its longer shelf life compared to fresh meat reduces food waste and storage costs which makes it a sensible choice for both consumers and retailers.
Moreover, the versatility of textured vegetable protein enhances its cost-effectiveness by allowing for a wide range of culinary applications in various food products. From meat analogues to snacks, cereals, and bakery items, textured vegetable protein is adopted into diverse recipes to create affordable and nutritious alternatives to traditional meat-based dishes. This versatility expands its market potential and offers food manufacturers opportunities for product innovation and differentiation which drives consumer interest and loyalty. Furthermore, as the demand for plant-based protein alternatives continues to grow globally, economies of scale in textured vegetable protein production are likely to further reduce costs and make it an even more cost-effective option in the future. Thus, all these factors drive the demand for textured vegetable protein market.
Supply chain vulnerabilities represent a significant restraint on the market demand for textured vegetable protein. Textured vegetable protein production relies heavily on a steady and reliable supply of raw materials, primarily soybeans or other plant proteins. However, the global agricultural supply chain is susceptible to various disruptions, including adverse weather conditions, fluctuations in crop yields, and geopolitical conflicts. These supply chain vulnerabilities result in shortages or fluctuations in the availability of raw materials which often lead to production delays and increased costs for textured vegetable protein manufacturers. In addition, dependence on a limited number of suppliers or regions for sourcing raw materials exacerbates supply chain risks and further impacts the demand for textured vegetable protein market.
Rise in the growth of the foodservice industry presents numerous opportunities for textured vegetable protein market as consumer preferences pivot toward healthier and more sustainable dining options, foodservice establishments like restaurants, cafes, and institutional catering services are increasingly integrating plant-based offerings into their menus. Textured vegetable protein emerges as a versatile solution for chefs and foodservice operators who seek to cater to the surging demand for plant-based protein alternatives. Its adaptable nature allows for seamless adoption into a myriad of dishes, ranging from burgers and tacos to stir-fries and salads. Moreover, leveraging textured vegetable protein, foodservice providers diversify their menu offerings and tap into the growing consumer demographic of vegans, vegetarians, and health-conscious individuals, thus enhancing their demand and competitiveness in the market.
Furthermore, the foodservice sector provides a platform for textured vegetable protein manufacturers to showcase the culinary possibilities of their products and adopt collaborations with industry stakeholders. Partnering with chefs and foodservice distributors enables textured vegetable protein suppliers to co-create innovative recipes and menu concepts that highlight the flavor, texture, and nutritional benefits of textured vegetable protein-based dishes. Thus, all these factors present several opportunities for textured vegetable protein market.
The textured vegetable protein market is segmented into type, form, end user, and region. By type, the market is classified into textured soy protein and others. By form, the market is divided into flakes, granules, chunks, and others. By end user, the market is bifurcated into B2B and B2C. Region-wise, the market is analyzed across North America (the U.S., Canada, and Mexico), Europe (the UK, Germany, France, Italy, Spain, and the rest of Europe), Asia-Pacific (China, India, Japan, South Korea, and the rest of Asia-Pacific), and Latin America (Brazil, Argentina, Colombia, and rest of Latin America) Middle East of Africa (GCC, South Africa, and rest of MEA).
Players operating in the global textured vegetable protein market have adopted various developmental strategies to expand their textured vegetable protein market share, increase profitability, and remain competitive in the market. Key players profiled in this report include Archer Daniels Midland Company, Axiom Foods, Cargill, Incorporated Inc., Du Pont de Nemours and Company, Foodchem International Corporation, Hung Yang Foods Co., Ltd., Sonic Biochem Extraction Pvt Ltd, Sudzucker Group (Beneo), Victoria Group A.D., and Wilmar International Limited.
Key Benefits For Stakeholders
- This report provides a quantitative analysis of the market segments, current trends, estimations, and dynamics of the textured vegetable protein market analysis from 2023 to 2035 to identify the prevailing textured vegetable protein market opportunities.
- The market research is offered along with information related to key drivers, restraints, and opportunities.
- Porter's five forces analysis highlights the potency of buyers and suppliers to enable stakeholders make profit-oriented business decisions and strengthen their supplier-buyer network.
- In-depth analysis of the textured vegetable protein market segmentation assists to determine the prevailing market opportunities.
- Major countries in each region are mapped according to their revenue contribution to the global market.
- Market player positioning facilitates benchmarking and provides a clear understanding of the present position of the market players.
- The report includes the analysis of the regional as well as global textured vegetable protein market trends, key players, market segments, application areas, and market growth strategies.
Additional benefits you will get with this purchase are:
- Quarterly Update and* (only available with a corporate license, on listed price)
- 5 additional Company Profile of client Choice pre- or Post-purchase, as a free update.
- Free Upcoming Version on the Purchase of Five and Enterprise User License.
- 16 analyst hours of support* (post-purchase, if you find additional data requirements upon review of the report, you may receive support amounting to 16 analyst hours to solve questions, and post-sale queries)
- 15% Free Customization* (in case the scope or segment of the report does not match your requirements, 15% is equivalent to 3 working days of free work, applicable once)
- Free data Pack on the Five and Enterprise User License. (Excel version of the report)
- Free Updated report if the report is 6-12 months old or older.
- 24-hour priority response*
- Free Industry updates and white papers.
Possible Customization with this report (with additional cost and timeline, please talk to the sales executive to know more)
- Consumer Preference and Product Specifications
- Market share analysis of players by products/segments
- Additional company profiles with specific to client's interest
- Expanded list for Company Profiles
- Key player details (including location, contact details, supplier/vendor network etc. in excel format)
- SWOT Analysis
Key Market Segments
By PRODUCT TYPE
- Textured soy protein
- Others
By END USER
- Business to Business
- Business to consumer
By FORM
- Granules
- Flakes
- Chunks
- Others
By Region
- North America
- U.S.
- Canada
- Mexico
- Europe
- UK
- Germany
- France
- Italy
- Spain
- Rest of Europe
- Asia-Pacific
- China
- India
- Japan
- South Korea
- Rest of Asia-Pacific
- Latin America
- Brazil
- Argentina
- Colombia
- Rest of Latin America
- Middle East and Africa
- Gcc
- South Africa
- Rest of Middle East And Africa
Key Market Players:
- Archer Daniels Midland Company
- Cargill Incorporated Inc.
- Du Pont de Nemours and Company
- Foodchem International Corporation
- Hung Yang Foods Co., Ltd
- Sonic Biochem Extraction Pvt Ltd
- Sudzucker Group(Beneo)
- Victoria Group A.D.
- Wilmar International Limited
TABLE OF CONTENTS
CHAPTER 1: INTRODUCTION
- 1.1. Report description
- 1.2. Key market segments
- 1.3. Key benefits to the stakeholders
- 1.4. Research methodology
- 1.4.1. Primary research
- 1.4.2. Secondary research
- 1.4.3. Analyst tools and models
CHAPTER 2: EXECUTIVE SUMMARY
- 2.1. CXO perspective
CHAPTER 3: MARKET OVERVIEW
- 3.1. Market definition and scope
- 3.2. Key findings
- 3.2.1. Top impacting factors
- 3.2.2. Top investment pockets
- 3.3. Porter's five forces analysis
- 3.4. Market dynamics
- 3.4.1. Drivers
- 3.4.2. Restraints
- 3.4.3. Opportunities
CHAPTER 4: TEXTURED VEGETABLE PROTEIN MARKET, BY PRODUCT TYPE
- 4.1. Overview
- 4.1.1. Market size and forecast
- 4.2. Textured soy protein
- 4.2.1. Key market trends, growth factors and opportunities
- 4.2.2. Market size and forecast, by region
- 4.2.3. Market share analysis by country
- 4.3. Others
- 4.3.1. Key market trends, growth factors and opportunities
- 4.3.2. Market size and forecast, by region
- 4.3.3. Market share analysis by country
CHAPTER 5: TEXTURED VEGETABLE PROTEIN MARKET, BY END USER
- 5.1. Overview
- 5.1.1. Market size and forecast
- 5.2. Business to Business
- 5.2.1. Key market trends, growth factors and opportunities
- 5.2.2. Market size and forecast, by region
- 5.2.3. Market share analysis by country
- 5.3. Business to consumer
- 5.3.1. Key market trends, growth factors and opportunities
- 5.3.2. Market size and forecast, by region
- 5.3.3. Market share analysis by country
CHAPTER 6: TEXTURED VEGETABLE PROTEIN MARKET, BY FORM
- 6.1. Overview
- 6.1.1. Market size and forecast
- 6.2. Granules
- 6.2.1. Key market trends, growth factors and opportunities
- 6.2.2. Market size and forecast, by region
- 6.2.3. Market share analysis by country
- 6.3. Flakes
- 6.3.1. Key market trends, growth factors and opportunities
- 6.3.2. Market size and forecast, by region
- 6.3.3. Market share analysis by country
- 6.4. Chunks
- 6.4.1. Key market trends, growth factors and opportunities
- 6.4.2. Market size and forecast, by region
- 6.4.3. Market share analysis by country
- 6.5. Others
- 6.5.1. Key market trends, growth factors and opportunities
- 6.5.2. Market size and forecast, by region
- 6.5.3. Market share analysis by country
CHAPTER 7: TEXTURED VEGETABLE PROTEIN MARKET, BY REGION
- 7.1. Overview
- 7.1.1. Market size and forecast By Region
- 7.2. North America
- 7.2.1. Key market trends, growth factors and opportunities
- 7.2.2. Market size and forecast, by PRODUCT TYPE
- 7.2.3. Market size and forecast, by END USER
- 7.2.4. Market size and forecast, by FORM
- 7.2.5. Market size and forecast, by country
- 7.2.5.1. U.S.
- 7.2.5.1.1. Market size and forecast, by PRODUCT TYPE
- 7.2.5.1.2. Market size and forecast, by END USER
- 7.2.5.1.3. Market size and forecast, by FORM
- 7.2.5.2. Canada
- 7.2.5.2.1. Market size and forecast, by PRODUCT TYPE
- 7.2.5.2.2. Market size and forecast, by END USER
- 7.2.5.2.3. Market size and forecast, by FORM
- 7.2.5.3. Mexico
- 7.2.5.3.1. Market size and forecast, by PRODUCT TYPE
- 7.2.5.3.2. Market size and forecast, by END USER
- 7.2.5.3.3. Market size and forecast, by FORM
- 7.3. Europe
- 7.3.1. Key market trends, growth factors and opportunities
- 7.3.2. Market size and forecast, by PRODUCT TYPE
- 7.3.3. Market size and forecast, by END USER
- 7.3.4. Market size and forecast, by FORM
- 7.3.5. Market size and forecast, by country
- 7.3.5.1. UK
- 7.3.5.1.1. Market size and forecast, by PRODUCT TYPE
- 7.3.5.1.2. Market size and forecast, by END USER
- 7.3.5.1.3. Market size and forecast, by FORM
- 7.3.5.2. Germany
- 7.3.5.2.1. Market size and forecast, by PRODUCT TYPE
- 7.3.5.2.2. Market size and forecast, by END USER
- 7.3.5.2.3. Market size and forecast, by FORM
- 7.3.5.3. France
- 7.3.5.3.1. Market size and forecast, by PRODUCT TYPE
- 7.3.5.3.2. Market size and forecast, by END USER
- 7.3.5.3.3. Market size and forecast, by FORM
- 7.3.5.4. Italy
- 7.3.5.4.1. Market size and forecast, by PRODUCT TYPE
- 7.3.5.4.2. Market size and forecast, by END USER
- 7.3.5.4.3. Market size and forecast, by FORM
- 7.3.5.5. Spain
- 7.3.5.5.1. Market size and forecast, by PRODUCT TYPE
- 7.3.5.5.2. Market size and forecast, by END USER
- 7.3.5.5.3. Market size and forecast, by FORM
- 7.3.5.6. Rest of Europe
- 7.3.5.6.1. Market size and forecast, by PRODUCT TYPE
- 7.3.5.6.2. Market size and forecast, by END USER
- 7.3.5.6.3. Market size and forecast, by FORM
- 7.4. Asia-Pacific
- 7.4.1. Key market trends, growth factors and opportunities
- 7.4.2. Market size and forecast, by PRODUCT TYPE
- 7.4.3. Market size and forecast, by END USER
- 7.4.4. Market size and forecast, by FORM
- 7.4.5. Market size and forecast, by country
- 7.4.5.1. China
- 7.4.5.1.1. Market size and forecast, by PRODUCT TYPE
- 7.4.5.1.2. Market size and forecast, by END USER
- 7.4.5.1.3. Market size and forecast, by FORM
- 7.4.5.2. India
- 7.4.5.2.1. Market size and forecast, by PRODUCT TYPE
- 7.4.5.2.2. Market size and forecast, by END USER
- 7.4.5.2.3. Market size and forecast, by FORM
- 7.4.5.3. Japan
- 7.4.5.3.1. Market size and forecast, by PRODUCT TYPE
- 7.4.5.3.2. Market size and forecast, by END USER
- 7.4.5.3.3. Market size and forecast, by FORM
- 7.4.5.4. South Korea
- 7.4.5.4.1. Market size and forecast, by PRODUCT TYPE
- 7.4.5.4.2. Market size and forecast, by END USER
- 7.4.5.4.3. Market size and forecast, by FORM
- 7.4.5.5. Rest of Asia-Pacific
- 7.4.5.5.1. Market size and forecast, by PRODUCT TYPE
- 7.4.5.5.2. Market size and forecast, by END USER
- 7.4.5.5.3. Market size and forecast, by FORM
- 7.5. Latin America
- 7.5.1. Key market trends, growth factors and opportunities
- 7.5.2. Market size and forecast, by PRODUCT TYPE
- 7.5.3. Market size and forecast, by END USER
- 7.5.4. Market size and forecast, by FORM
- 7.5.5. Market size and forecast, by country
- 7.5.5.1. Brazil
- 7.5.5.1.1. Market size and forecast, by PRODUCT TYPE
- 7.5.5.1.2. Market size and forecast, by END USER
- 7.5.5.1.3. Market size and forecast, by FORM
- 7.5.5.2. Argentina
- 7.5.5.2.1. Market size and forecast, by PRODUCT TYPE
- 7.5.5.2.2. Market size and forecast, by END USER
- 7.5.5.2.3. Market size and forecast, by FORM
- 7.5.5.3. Colombia
- 7.5.5.3.1. Market size and forecast, by PRODUCT TYPE
- 7.5.5.3.2. Market size and forecast, by END USER
- 7.5.5.3.3. Market size and forecast, by FORM
- 7.5.5.4. Rest of Latin America
- 7.5.5.4.1. Market size and forecast, by PRODUCT TYPE
- 7.5.5.4.2. Market size and forecast, by END USER
- 7.5.5.4.3. Market size and forecast, by FORM
- 7.6. Middle East and Africa
- 7.6.1. Key market trends, growth factors and opportunities
- 7.6.2. Market size and forecast, by PRODUCT TYPE
- 7.6.3. Market size and forecast, by END USER
- 7.6.4. Market size and forecast, by FORM
- 7.6.5. Market size and forecast, by country
- 7.6.5.1. Gcc
- 7.6.5.1.1. Market size and forecast, by PRODUCT TYPE
- 7.6.5.1.2. Market size and forecast, by END USER
- 7.6.5.1.3. Market size and forecast, by FORM
- 7.6.5.2. South Africa
- 7.6.5.2.1. Market size and forecast, by PRODUCT TYPE
- 7.6.5.2.2. Market size and forecast, by END USER
- 7.6.5.2.3. Market size and forecast, by FORM
- 7.6.5.3. Rest of Middle East And Africa
- 7.6.5.3.1. Market size and forecast, by PRODUCT TYPE
- 7.6.5.3.2. Market size and forecast, by END USER
- 7.6.5.3.3. Market size and forecast, by FORM
CHAPTER 8: COMPETITIVE LANDSCAPE
- 8.1. Introduction
- 8.2. Top winning strategies
- 8.3. Product mapping of top 10 player
- 8.4. Competitive dashboard
- 8.5. Competitive heatmap
- 8.6. Top player positioning, 2023
CHAPTER 9: COMPANY PROFILES
- 9.1. Archer Daniels Midland Company
- 9.1.1. Company overview
- 9.1.2. Key executives
- 9.1.3. Company snapshot
- 9.1.4. Operating business segments
- 9.1.5. Product portfolio
- 9.1.6. Business performance
- 9.1.7. Key strategic moves and developments
- 9.2. Cargill Incorporated Inc.
- 9.2.1. Company overview
- 9.2.2. Key executives
- 9.2.3. Company snapshot
- 9.2.4. Operating business segments
- 9.2.5. Product portfolio
- 9.2.6. Business performance
- 9.2.7. Key strategic moves and developments
- 9.3. Du Pont de Nemours and Company
- 9.3.1. Company overview
- 9.3.2. Key executives
- 9.3.3. Company snapshot
- 9.3.4. Operating business segments
- 9.3.5. Product portfolio
- 9.3.6. Business performance
- 9.3.7. Key strategic moves and developments
- 9.4. Foodchem International Corporation
- 9.4.1. Company overview
- 9.4.2. Key executives
- 9.4.3. Company snapshot
- 9.4.4. Operating business segments
- 9.4.5. Product portfolio
- 9.4.6. Business performance
- 9.4.7. Key strategic moves and developments
- 9.5. Hung Yang Foods Co., Ltd
- 9.5.1. Company overview
- 9.5.2. Key executives
- 9.5.3. Company snapshot
- 9.5.4. Operating business segments
- 9.5.5. Product portfolio
- 9.5.6. Business performance
- 9.5.7. Key strategic moves and developments
- 9.6. Sonic Biochem Extraction Pvt Ltd
- 9.6.1. Company overview
- 9.6.2. Key executives
- 9.6.3. Company snapshot
- 9.6.4. Operating business segments
- 9.6.5. Product portfolio
- 9.6.6. Business performance
- 9.6.7. Key strategic moves and developments
- 9.7. Sudzucker Group(Beneo)
- 9.7.1. Company overview
- 9.7.2. Key executives
- 9.7.3. Company snapshot
- 9.7.4. Operating business segments
- 9.7.5. Product portfolio
- 9.7.6. Business performance
- 9.7.7. Key strategic moves and developments
- 9.8. Victoria Group A.D.
- 9.8.1. Company overview
- 9.8.2. Key executives
- 9.8.3. Company snapshot
- 9.8.4. Operating business segments
- 9.8.5. Product portfolio
- 9.8.6. Business performance
- 9.8.7. Key strategic moves and developments
- 9.9. Wilmar International Limited
- 9.9.1. Company overview
- 9.9.2. Key executives
- 9.9.3. Company snapshot
- 9.9.4. Operating business segments
- 9.9.5. Product portfolio
- 9.9.6. Business performance
- 9.9.7. Key strategic moves and developments
 組織化植物性蛋白質市場規模、佔有率及成長分析(按類型、來源、應用、性質和地區)-2025-2032 年產業預測
 2021 - 2031 年紋理植物蛋白市場規模及預測、全球及地區佔有率、趨勢及成長機會分析報告範圍:按來源、產品類型、類別、應用和地理分類組織化植物蛋白市場:依產品類型、應用和地區2030 年紋理植物蛋白市場預測:按形式、特性、分銷管道、最終用戶和地區進行的全球分析
 結構化植物性蛋白質的全球市場規模:按產品、按應用、按地區、範圍和預測
 全球植物紋理蛋白市場:按類型、應用、特性、地區 - 預測(~2029 年)
 組織化植物性蛋白質市場:依類型、特性、形式、應用分類 -2030年全球預測到 2030 年植物紋理蛋白 (TVP) 市場預測:按產品、型態、分銷管道、最終用戶和地區進行的全球分析
 全球組織化植物蛋白市場 - 2023-2030
 組織化植物蛋白市場規模-按產品類型(組織化大豆蛋白(TSP)、組織化小麥蛋白(TWP)和組織化豌豆蛋白(TPP))、形式(切片、薄片、顆粒和塊)、應用、區域前景和2023-2032 年全球預測