


 |
市場調查報告書
商品編碼
1631638
亞太地區風力發電機葉輪:市場佔有率分析、產業趨勢和成長預測(2025-2030)Asia Pacific Wind Turbine Rotor Blade - Market Share Analysis, Industry Trends & Statistics, Growth Forecasts (2025 - 2030) |
||||||
※ 本網頁內容可能與最新版本有所差異。詳細情況請與我們聯繫。
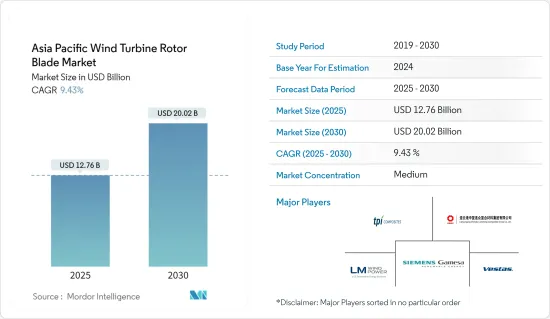
預計2025年亞太地區風力發電機葉輪市場規模為127.6億美元,預測期內(2025-2030年)複合年成長率為9.43%,到2030年將達到200.2億美元。
從中期來看,風電成本下降和風電產業投資增加等因素預計將在預測期內推動亞太地區風力發電機葉輪市場的發展。
另一方面,運輸成本的相關上升以及太陽能和水力發電等替代清潔能源的成本競爭等因素有可能在預測期內阻礙市場成長。
也就是說,風電產業需要具有成本效益的解決方案,而高效率的產品有可能改變產業的動態。在某些情況下,舊渦輪機被更換,不是因為損壞,而是因為市場上出現了更有效率的葉片。因此,技術發展很快將成為風力發電機葉輪市場的機會。
預計在預測期內,中國將主導亞太地區風力發電機葉輪市場。
亞太地區風力發電機葉輪市場趨勢
土地領域主導市場
- 陸域風電技術在過去五年中不斷發展,以最大限度地提高每兆瓦裝置容量的發電量,並覆蓋更多風速較低的地區。除此之外,近年來風力發電機變得越來越大,輪轂更高,直徑更寬,風力發電機葉片也更大。
- 根據全球風能理事會(GWEC)預測,2022年亞太陸上風電市場將新增3,697千萬瓦,佔全球陸上風電總裝置容量的53.72%。
- 中國和印度等幾個主要國家的投資增加預計將在預測期內推動市場需求。中國和印度是世界上成長最快的經濟體之一,因此國內電力消耗量也強勁成長。
- 在2021年石化燃料的COP26上,印度總理宣布,印度計劃在2030年將排放強度降低45%以上,使其低於2005年的水平,並宣佈到2030年能源容量將增加到500GW,到2030 年, 50% 的能源結構將是再生能源。
- 截至2022年1月,非石化燃料佔總發電量的38.5%。風電目前佔其中的10.2%。作為 2030 年氣候行動的一部分,新能源和可再生能源部 (MNRE) 估計將需要 140GW 的風電容量。
- 2022 年 10 月,煤炭部下屬公共部門企業 (PSU) NLC India Ltd. 宣布與新能源和可再生能源部下屬研發機構國家風力發電研究所 (NIWE) 建立合作夥伴關係。開發陸域風發電工程的策略合作協議。
- 截至2022年,印度陸域風電裝置容量持有全球第四。這些計劃主要分佈在該國的北部、南部和西部地區。根據IRENA統計,印度風電總裝置容量為41.93兆瓦,較2021年的40.06兆瓦成長4.64%。
- 此外,根據國際能源總署的數據,平準化能源成本(LCOE)和全球加權平均總資本支出將從2016年的76.1美元/兆瓦時和1730.5美元/兆瓦時增加到2021年的48.2美元/兆瓦時。此外,LCOE 和平均加權資本支出預計在預測期內下降,並於 2025 年分別達到 44.6 美元/MWh 和 1338.2 美元/MWh。
- 由於平準化度電成本的降低和資本支出的減少,加上清潔能源來源帶來的高能源需求,陸上大型風力發電機的葉輪市場預計將在預測期內成長。
中國主導市場
- 中國是世界上最大的能源消費國和可再生能源市場。該國一直在努力解決主要來自石化燃料發電廠排放氣體的空氣污染問題,並致力於擴大可再生能源產能,以滿足不斷成長的能源需求,同時減少整體排放。
- 作為「十四五」規劃(2021-2025)的一部分,該國的目標是到2025年供應國內電力消耗的33%和非水力發電可再生能源的18%。該國的目標是到 2030 年將可再生能源發電增加到 3,300 太瓦。
- 在最新的國家自主貢獻(NDC)中,中國承諾在 2030 年達到高峰排放並實現碳中和,作為其在《巴黎協定》下承諾的一部分。在能源目標方面,我們的目標是與 2005 年相比,單位 GDP 二氧化碳排放減少 65% 以上,並將風能和太陽能總合裝置容量增加到 1,200 吉瓦。
- 基於該國可再生能源產業的快速成長,CarbonBrief估計,風能和太陽能裝置1,200吉瓦的目標將在2030年的最後期限之前提前實現。風力發電裝置容量的快速成長是由於解決環境問題所產生的需求增加,預計國內能源消耗的增加將在預測期內推動風力發電市場的發展。
- 中國每個省份都制定了可再生能源計劃的單獨目標,作為其國家目標的一部分。西北地區的內蒙古自治區和甘肅省設定的最大目標是利用大片沙漠地區的優勢。兩省計畫在截至2022年5月的裝置容量74GW的基礎上,到2025年累積新增風電和太陽能發電工程190GW。緊隨其後的是陝西、河北和山東,這些省份計劃在 2021 年至 2025 年間新建太陽能和風電裝置容量 190GW。
- 根據GWEC統計,2022年,中國風電總裝置容量與前一年同期比較%。風力發電總設備容量約為365.44GW。
- 中國沿海地區正在重點發展新型離岸風力發電。廣東省計畫在2025年離岸風力發電達1800萬千瓦,福建省、浙江省和江蘇省計畫到2025年離岸風力發電分別為1330千萬瓦、600萬千瓦和900萬千瓦。計劃.
- 山東省計畫在2030年新增離岸風力發電裝置容量3500萬千瓦,同時動工1000萬千瓦計劃,到2025年新增併網容量5000萬千瓦。國家能源局(NEA)已批准海南省到2025年建設離岸風力發電1230萬千瓦。
- 此外,2022年12月,中國風力發電機製造商明陽智慧能源宣布推出全球最長的抗颱風離岸風機MySE 16-260離岸風力發電機,這是2021年推出的16MW機型的升級版,轉子直徑為242m。製造風力發電機葉片。
- 因此,國有企業投資的增加和政府對風力發電的有利政策預計將在預測期內推動中國風力發電機葉輪市場的成長。
亞太地區風力發電機葉輪產業概況
亞太地區風力發電機葉輪市場較為分散。該市場的主要企業包括連雲港中復連眾複合材料集團、TPI Composites Inc.、LM Wind Power(GE 再生能源業務)、Siemens Gamesa Renewable Energy SA 和 Vestas Wind Systems A/S。
其他好處:
- Excel 格式的市場預測 (ME) 表
- 3 個月分析師支持
目錄
第1章簡介
- 調查範圍
- 市場定義
- 研究場所
第 2 章執行摘要
第3章調查方法
第4章市場概況
- 介紹
- 2029年之前的市場規模與需求預測(單位:美元)
- 最新趨勢和發展
- 政府法規政策
- 市場動態
- 促進因素
- 風力發電成本下降
- 加大風發電工程投資
- 抑制因素
- 更多採用替代清潔能源
- 促進因素
- 供應鏈分析
- 波特五力分析
- 供應商的議價能力
- 消費者議價能力
- 新進入者的威脅
- 替代品的威脅
- 競爭公司之間的敵對關係
第5章市場區隔
- 按部署地點
- 陸上
- 離岸
- 按刀片材質分
- 碳纖維
- 玻璃纖維
- 其他刀片材料
- 按地區
- 中國
- 印度
- 韓國
- 日本
- 馬來西亞
- 泰國
- 印尼
- 越南
- 其他亞太地區
第6章 競爭狀況
- 併購、合資、聯盟、協議
- 主要企業策略
- Companies Profiles
- TPI Composites Inc.
- Lianyungang Zhongfu Lianzhong Composites Group Co., Ltd.
- LM Wind Power(a GE Renewable Energy Business)
- Siemens Gamesa Renewable Energy SA
- Vestas Wind Systems A/S
- Sinoma Technology Wind Power Blade Co., Ltd.
- Suzlon Energy Limited
- Nordex SE
- Enercon GmbH
- 市場排名/佔有率分析
第7章 市場潛力及未來趨勢
- 新興和未開發市場對離岸風力發電的興趣日益濃厚
The Asia Pacific Wind Turbine Rotor Blade Market size is estimated at USD 12.76 billion in 2025, and is expected to reach USD 20.02 billion by 2030, at a CAGR of 9.43% during the forecast period (2025-2030).
Over the medium term, factors such as the declining cost of wind energy and increasing investments in the wind power sector are expected to drive the wind turbine rotor blade market in the Asia-Pacific region during the forecast period.
On the other hand, factors such as the associated high cost of transportation and cost competitiveness of alternate clean power sources like solar power, hydropower, etc., have the potential to hinder the market growth during the forecast period.
Nevertheless, the wind power industry has been in demand for cost-effective solutions, and a highly efficient product has the potential to change the dynamics of the industry. There were instances where old turbines were replaced, not because of the damage but due to the availability of more efficient blades in the market. Hence, technological developments present themselves as a good opportunity for the wind turbine rotor blade market soon.
China is expected to dominate the wind turbine rotor blade market in the Asia-Pacific region during the forecast period.
Asia-Pacific Wind Turbine Rotor Blade Market Trends
Onshore Segment to Dominate the Market
- The onshore wind energy power generation technology has evolved over the last five years to maximize electricity produced per megawatt capacity installed and to cover more sites with lower wind speeds. Besides this, in recent years, wind turbines have become larger with taller hub heights, broader diameters, and larger wind turbine blades.
- According to the Global Wind Energy Council (GWEC), the Asia-Pacific onshore wind market added 36.97 GW in 2022 and contributed 53.72% of the total global onshore wind installations in 2022.
- The growing investments in several major countries, such as China and India, are expected to drive the market demand during the forecast period. China and India are some of the fastest-growing economies in the world, and hence, they have registered significant growth in domestic power consumption.
- During COP26 in November 2021, the Prime Minister of India announced that India plans to reduce emission intensity by 45% or more by 2030, bringing it to levels below those of 2005, and announced 500 GW of non-fossil fuels energy capacity by 2030; 50% renewables in the energy mix by 2030.
- As of January 2022, non-fossil fuels represent 38.5% of overall power generation capacity. Wind currently accounts for 10.2% of this capacity. As part of its 2030 climate commitments, the Ministry of New and Renewable Energy (MNRE) estimates 140 GW of wind energy capacity is required.
- In October 2022, the NLC India Ltd., a Public Sector Undertaking (PSU) part of the Ministry of Coal, entered into a strategic collaboration agreement with the National Institute of Wind Energy (NIWE), an autonomous Research and Development institution under the Ministry of New and Renewable Energy (MNRE), for the development of onshore wind power projects in India.
- India holds the fourth-largest onshore wind power installed capacity globally as of 2022. These projects are majorly spread in the northern, southern, and western parts of the country. According to IRENA, India's total installed wind capacity was 41.93 GW, witnessing an increase of 4.64% compared to 40.06 GW in 2021.
- Moreover, according to the International Energy Agency, the Levelized cost of energy (LCOE) and global weighted average total CAPEX is likely to decrease from 76.1 USD/MWh and 1730.5 USD/MWh in 2016 to 48.2 USD/MWh and 1396.3 USD/MWh in 2021. In addition, the LCOE and average weighted CAPEX are expected to decrease in the forecast period to 44.6 USD/MWh and 1338.2 USD/MWh, respectively, by 2025.
- The onshore large wind turbine rotor blade market is expected to grow in the forecast period due to declining LCOE and reduced CAPEX, coupled with high energy demand through clean sources.
China to Dominate the Market
- China is the largest energy consumer and renewable energy market globally, and the country is rapidly expanding its renewable energy capacity to satiate its domestic energy demand. As the country has been suffering from air pollution caused primarily by fossil-fuel-fired power plant emissions, it has focused on expanding its renewable energy capacity to meet its growing energy demands while reducing overall emissions.
- As part of its 14th five-year plan (2021-2025), the country aims to supply 33% of national power consumption by 2025 and 18% of non-hydro renewables. The country aims to increase renewable energy generation to 3,300 TWh by 2030.
- In its latest updated Nationally Determined Contributions (NDC), China has committed to reaching peak emissions by 2030 and achieving carbon neutrality as part of its commitments under the Paris Agreement. In terms of energy targets, the country aims to cut C02 emissions per unit of GDP by more than 65% from 2005 levels and increase the total installed wind plus solar capacity to 1,200 GW.
- According to CarbonBrief, based on the rapid growth of the renewable energy industry in the country, it is estimated that China will reach its target of 1,200 GW of wind+solar deployment significantly ahead of its 2030 deadline. Such rapid growth in the installed wind energy capacity is due to the rising demand created due to environmental commitments, and the increasing domestic energy consumption is expected to drive the wind energy market during the forecast period.
- China's provinces have set up individual targets for renewable energy projects as a part of national targets. The largest targets have been set up by the northwestern provinces of Inner Mongolia and Gansu to leverage the presence of large tracts of uninhabited desert lands. These two provinces plan to add a cumulative 190 GW of wind and solar projects by 2025, in addition to the 74 GW of installed capacity as of May 2022. These provinces are followed by Shaanxi, Hebei, and Shandong, which have planned to install 190 GW of new solar and wind capacity additions during 2021-2025.
- According to GWEC, in 2022, the total wind installed capacity increased by 11.5% compared to the previous year in China. The total wind energy installed capacity accounted for about 365.44 GW.
- Coastal provinces in China have been focused on developing new offshore wind capacity. Guangdong aims to install 18 GW of offshore capacity by 2025, while Fujian, Zhejiang, and Jiangsu aim to install 13.3GW, 6GW, and 9GW of offshore wind power projects by 2025, respectively.
- Shandong aims to add 35 GW of offshore wind power capacity by 2030 while starting the construction of 10 GW of projects and adding 5 GW to the grid by 2025. The island province of Hainan has been permitted by the National Energy Administration (NEA) to build 12.3 GW of offshore wind by 2025.
- Further, in December 2022, Chinese wind turbine manufacturer Mingyang Smart Energy produced the World's Longest Anti-Typhoon Offshore Wind Turbine Blade for the MySE 16-260 offshore wind turbine, an elevated version of its 16 MW model, announced in 2021 with a 242-meter rotor diameter.
- Thus, the growing investment from state-owned companies and favorable government policies in wind energy generation are expected to drive the growth of the Chinese wind turbine rotor blade market during the forecast period.
Asia-Pacific Wind Turbine Rotor Blade Industry Overview
The Asia-Pacific wind turbine rotor blade market is moderately fragmented. Some of the major players in the market include Lianyungang Zhongfu Lianzhong Composites Group Co., Ltd., TPI Composites Inc., LM Wind Power (a GE Renewable Energy Business), Siemens Gamesa Renewable Energy S.A., and Vestas Wind Systems A/S, among others.
Additional Benefits:
- The market estimate (ME) sheet in Excel format
- 3 months of analyst support
TABLE OF CONTENTS
1 INTRODUCTION
- 1.1 Scope of the Study
- 1.2 Market Definition
- 1.3 Study Assumptions
2 EXECUTIVE SUMMARY
3 RESEARCH METHODOLOGY
4 MARKET OVERVIEW
- 4.1 Introduction
- 4.2 Market Size and Demand Forecast in USD, till 2029
- 4.3 Recent Trends and Developments
- 4.4 Government Policies and Regulations
- 4.5 Market Dynamics
- 4.5.1 Drivers
- 4.5.1.1 Declining Cost of Wind Energy
- 4.5.1.2 Increasing Investments in Wind Energy Power Generation Projects
- 4.5.2 Restraints
- 4.5.2.1 Increasing Adoption of Alternate Clean Power Sources
- 4.5.1 Drivers
- 4.6 Supply Chain Analysis
- 4.7 Porter's Five Forces Analysis
- 4.7.1 Bargaining Power of Suppliers
- 4.7.2 Bargaining Power of Consumers
- 4.7.3 Threat of New Entrants
- 4.7.4 Threat of Substitutes Products and Services
- 4.7.5 Intensity of Competitive Rivalry
5 MARKET SEGEMENTATION
- 5.1 Location of Deployment
- 5.1.1 Onshore
- 5.1.2 Offshore
- 5.2 Blade Material
- 5.2.1 Carbon Fiber
- 5.2.2 Glass Fiber
- 5.2.3 Other Blade Materials
- 5.3 Geography
- 5.3.1 China
- 5.3.2 India
- 5.3.3 South Korea
- 5.3.4 Japan
- 5.3.5 Malaysia
- 5.3.6 Thailand
- 5.3.7 Indonesia
- 5.3.8 Vietnam
- 5.3.9 Rest of Asia-Pacific
6 COMPETITIVE LANDSCAPE
- 6.1 Mergers and Acquisitions, Joint Ventures, Collaborations, and Agreements
- 6.2 Strategies Adopted by Leading Players
- 6.3 Companies Profiles
- 6.3.1 TPI Composites Inc.
- 6.3.2 Lianyungang Zhongfu Lianzhong Composites Group Co., Ltd.
- 6.3.3 LM Wind Power (a GE Renewable Energy Business)
- 6.3.4 Siemens Gamesa Renewable Energy S.A.
- 6.3.5 Vestas Wind Systems A/S
- 6.3.6 Sinoma Technology Wind Power Blade Co., Ltd.
- 6.3.7 Suzlon Energy Limited
- 6.3.8 Nordex SE
- 6.3.9 Enercon GmbH
- 6.4 Market Ranking/Share Analysis
7 MARKET OPPORTUNITIES and FUTURE TRENDS
- 7.1 Increasing Interest in Offshore Wind Energy from Developing and Untapped Markets
 風力渦輪機轉子葉片市場報告,按葉片材料(碳纖維、玻璃纖維等)、葉片長度(45 公尺以下、45-60 公尺、60 公尺以上)、部署位置(陸上、海上)和地區分類,2025 年至 2033 年
 風力發電機葉輪:市場佔有率分析、行業趨勢和統計、成長預測(2025-2030 年)
 中國風力發電機葉輪:市場佔有率分析、產業趨勢/統計、成長預測(2025-2030)
 北美葉輪:市場佔有率分析、行業趨勢和成長預測(2025-2030)
 南美洲葉輪:市場佔有率分析、產業趨勢、成長預測(2025-2030)
 德國葉輪:市場佔有率分析、產業趨勢與統計、成長預測(2025-2030)
 歐洲葉輪:市場佔有率分析、產業趨勢/統計、成長預測(2025-2030)
 法國葉輪:市場佔有率分析、產業趨勢、成長預測(2025-2030)
 英國葉輪:市場佔有率分析、行業趨勢和成長預測(2025-2030 年)
 西班牙的葉輪:市場佔有率分析、行業趨勢和統計、成長預測(2025-2030 年)