


 |
市場調查報告書
商品編碼
1683918
國際快遞服務-市場佔有率分析、產業趨勢與統計、成長預測(2025-2030 年)International Express Service - Market Share Analysis, Industry Trends & Statistics, Growth Forecasts (2025 - 2030) |
||||||
價格
※ 本網頁內容可能與最新版本有所差異。詳細情況請與我們聯繫。
簡介目錄
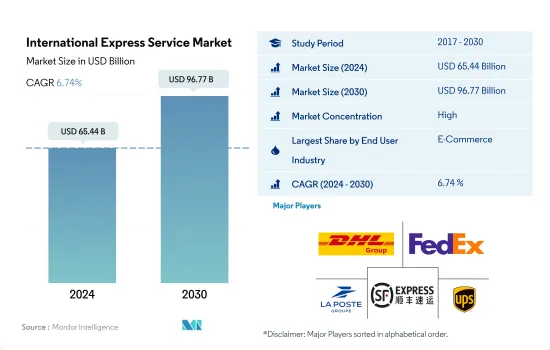
預計 2024 年國際快遞服務市場規模為 654.4 億美元,到 2030 年將達到 967.7 億美元,在市場估計和預測期(2024-2030 年)內複合年成長率為 6.74%。
截至 2022 年,美國和加拿大僅有 3% 的電子商務收益來自跨境交易。
- 在北美,隨著《美國-墨西哥-加拿大協定》(USMCA)的實施,小型零售商正受惠於快遞公司提供的降低成本。同樣,亞太國家也推出了多項促進跨境貿易的舉措,包括簡化海關手續和減少貿易壁壘。這為國際快遞業務的開展創造了更便利的環境。例如,印度與阿拉伯聯合大公國簽署了全面經濟夥伴協定(CEPA)。
- 隨著消費者增加線上訂單,新冠疫情和電子商務的成長刺激了國際快遞服務市場。在該地區,宅配公司和電子商務公司之間合作提供國際快遞服務的情況越來越普遍。例如,DHL 宣布與 BigCommerce(一個面向 B2C 和 B2B 品牌的快速成長的電子商務平台)合作,以幫助線上企業主在全球擴展其產品組合。截至 2022 年,美國和加拿大隻有 3% 的電子商務收益來自跨境交易。同時,跨境交易佔墨西哥電子商務收益的5%。預計未來幾年北美跨境B2C電子商務將逐步成長。
- 醫療設備國際快遞服務正在興起,原因有很多,包括對更快捷、更方便的醫療保健服務的需求日益成長。北美(尤其是美國)擁有最大的醫療保健宅配服務供應商,在全球醫療宅配市場佔據主導地位。預計未來幾年醫療保健產品的國際快遞服務將會成長。
需求成長、跨境貿易和電子商務的興起推動全球國際快遞服務的成長
- 在北美,美國佔據市場主導地位。這美國大型零售商目前向全球 200 多個地點提供國際當日送達和快遞服務,尤其是透過空運,67% 的美國預計 2021 年將實現當日送達。對於國際當日送達服務,零售商可以預期部分貨物將在 60 分鐘內收到。截至 2022 年,一些公司每天營運超過 2,000 個航班,專門用於當日或定時交付。 FedEx、DHL 和 UPS 是提供這些服務的主要零售商。
- 2022年,德國的紡織品和服飾貿易推動了對國際快遞服務的需求。德國出口紡織品價值408億美元,進口商品價值超過625億美元。中國是服飾最大的貿易夥伴,瑞士則是主要出口市場。此外,法國香水和化妝品貿易也創造了巨大的需求。僅從美國進口的商品就價值 570 億美元,在創造國際快遞服務需求方面發揮了關鍵作用。
- 中國、印度等國對國際快遞的需求也很高。其中,同城、遠距、國際及港澳台快遞業務量分別佔快遞業務總量的11.6%、86.6%及1.8%。隨著隔日和當日航空運輸需求的增加,印度 ASL 航空公司重新推出了 Quickjet 航班。亞馬遜航空將於2023年在印度推出空運服務。該公司旨在加快配送速度,為此投資了Quikjet,該公司目前在印度四個主要城市獨家運輸亞馬遜包裹。亞馬遜航空持有110 架噴射機,服務全球 70 個目的地。
國際快遞服務市場的全球趨勢
2022年北美運輸和倉儲市場規模將成長21.35%,達到6,426億美元。
- 亞太地區對交通運輸的需求日益成長,特別是承擔全球大部分海上貿易的海上運輸。該地區擁有全球最繁忙的九個貨櫃港口,佔全球地面貨運量的 40% 以上。到 2050 年,該地區的貨運需求預計將增加兩倍。同時,德國在運輸和倉儲領域已成為領導者,超過法國和英國,位居全球進出口第三位。為改善交通基礎設施,德國政府計劃在2022年向聯邦公路投資超過120億歐元(128.1億美元),向水道投資約18.1億美元。
- 預計2022年全球外國直接投資(FDI)流量將較去年與前一年同期比較下降24%至12,860億美元,不包括盧森堡將下降5%。美國仍是最大的外國直接投資流入國,流入金額為 3,180 億美元,其次是中國,流入金額較低,為 1,800 億美元。跨國併購活動放緩,交易數量下降,但待開發區投資前景依然樂觀。
- 北美運輸和倉儲經歷了顯著的成長,從2021與前一年同期比較14.31%成長到2022年的同比成長21.35%。這一成長涵蓋了運輸的各個方面,總額達到6426億美元。 2022年,美國推出了港口基礎設施發展計劃,為22個州的41運輸部計劃撥款超過7.03億美元,以改善港口能力、提高供應鏈可靠性並創造就業機會。
俄羅斯入侵烏克蘭已擾亂全球原油和石油產品市場一年多。
- 2022年,全球汽油平均價格為每公升1.22美元,較前一年上漲19%,高於新冠疫情前的水準。繼 2021 年經濟復甦而出現反彈之後,2022 年因戰爭導致供應中斷的風險導致油價上漲,油價也隨之上漲。與其他地區相比,歐洲的汽油價格最高。冰島、挪威、丹麥、希臘、芬蘭和荷蘭的汽油價格尤其高,每加侖 7.6 美元。
- 2022年上半年布蘭特原油價格大幅上漲,但下半年整體下跌。 2022年布蘭特原油現貨價格平均為每桶100美元。歐佩克原油總產量從2022年第三季的平均2,920萬桶/日下降到第四季的2,860萬桶/日。預計2023年OPEC原油產量平均為2,890萬桶/日。由於俄羅斯和沙烏地阿拉伯繼續減產130萬桶/日,油價自去年11月以來已達到高峰。
- 由於柴油是由原油生產的,因此其價格與柴油價格密切相關。由於對全球柴油供應的擔憂,美國和全球柴油價格在 2022 年春季飆升。儘管2022年下半年原油價格下跌,但由於季節性需求和歐洲柴油供應擔憂,美國柴油期貨價格在2022年10月再次上漲至每加侖3.95美元。俄羅斯是歐洲最大的柴油供應國。 2023年,歐洲和美國的柴油價格下跌,因為歐洲能夠用其他地區進口的柴油取代原本從俄羅斯進口的大部分柴油。
國際快遞行業概況
國際快遞服務市場格局較為集中,前五家公司合計佔有71.98%的市佔率。市場的主要企業是:DHL集團、聯邦快遞、法國郵政集團、順豐速遞(KEX-SF)和美國聯合包裹服務公司(UPS)(按字母順序排列)。
其他福利
- Excel 格式的市場預測 (ME) 表
- 3 個月的分析師支持
目錄
第 1 章執行摘要和主要發現
第2章 報告要約
第3章 引言
- 研究假設和市場定義
- 研究範圍
- 調查方法
第4章 產業主要趨勢
- 人口統計
- 按經濟活動分類的GDP分佈
- 經濟活動GDP成長
- 通貨膨脹率
- 經濟表現及概況
- 電子商務產業趨勢
- 製造業趨勢
- 交通運輸倉儲業GDP
- 出口趨勢
- 進口趨勢
- 燃油價格
- 物流績效
- 基礎設施
- 法律規範
- 阿根廷
- 澳洲
- 巴西
- 加拿大
- 智利
- 中國
- 埃及
- 法國
- 德國
- 印度
- 印尼
- 義大利
- 日本
- 馬來西亞
- 墨西哥
- 荷蘭
- 奈及利亞
- 巴基斯坦
- 菲律賓
- 卡達
- 俄羅斯
- 沙烏地阿拉伯
- 南非
- 西班牙
- 瑞士
- 泰國
- 阿拉伯聯合大公國
- 英國
- 美國
- 越南
- 價值鏈與通路分析
第5章 市場區隔
- 運輸重量
- 重量
- 輕的
- 中等重量
- 根
- 區域之間
- 區域內
- 最終用戶產業
- 電子商務
- 金融服務(BFSI)
- 衛生保健
- 製造業
- 一級產業
- 批發零售(線下)
- 其他
- 地區
- 非洲
- 按國家
- 埃及
- 奈及利亞
- 南非
- 其他非洲國家
- 亞太地區
- 按國家
- 澳洲
- 中國
- 印度
- 印尼
- 日本
- 馬來西亞
- 巴基斯坦
- 菲律賓
- 泰國
- 越南
- 其他亞太地區
- 歐洲
- 按國家
- 阿爾巴尼亞
- 保加利亞
- 克羅埃西亞
- 捷克共和國
- 丹麥
- 愛沙尼亞
- 芬蘭
- 法國
- 德國
- 匈牙利
- 冰島
- 義大利
- 拉脫維亞
- 立陶宛
- 荷蘭
- 挪威
- 波蘭
- 羅馬尼亞
- 俄羅斯
- 日本與斯洛伐克關係
- 斯洛維尼亞
- 西班牙
- 瑞典
- 瑞士
- 英國
- 歐洲其他地區
- GCC
- 按國家
- 卡達
- 沙烏地阿拉伯
- 阿拉伯聯合大公國
- 其他海灣合作理事會
- 北美洲
- 按國家
- 加拿大
- 墨西哥
- 美國
- 北美其他地區
- 南美洲
- 按國家
- 阿根廷
- 巴西
- 智利
- 南美洲其他地區
- 世界其他地區
- 非洲
第6章 競爭格局
- 關鍵策略趨勢
- 市場佔有率分析
- 業務狀況
- 公司簡介
- Aramex
- CJ Logistics Corporation
- DHL Group
- FedEx
- International Distributions Services(including GLS)
- Kintetsu Group Holdings
- La Poste Group
- Otto GmbH & Co. KG
- SF Express(KEX-SF)
- SG Holdings Co., Ltd.
- Toll Group
- United Parcel Service of America, Inc.(UPS)
第 7 章 CEO 需要回答的關鍵策略問題CEO 需要回答的關鍵策略問題
第 8 章 附錄
- 世界概況
- 概述
- 五力分析框架
- 全球價值鏈分析
- 市場動態(DRO)
- 技術進步
- 資訊來源及延伸閱讀
- 圖表清單
- 關鍵見解
- 資料包
- 詞彙表
簡介目錄
Product Code: 50001608
The International Express Service Market size is estimated at 65.44 billion USD in 2024, and is expected to reach 96.77 billion USD by 2030, growing at a CAGR of 6.74% during the forecast period (2024-2030).
Only 3% of e-commerce revenue was from cross-border transactions in the US and Canada as of 2022
- In North America, small retail businesses benefit from reduced expenses by express delivery carriers, resulting from the implementation of the United States-Mexico-Canada Agreement (USMCA). Similarly, the countries in Asia-Pacific have launched several initiatives to promote cross-border trade, including simplifying customs procedures and reducing trade barriers. This has created a more favorable environment for international express services to operate. For instance, India signed a Comprehensive Economic Partnership Agreement (CEPA) with the UAE.
- The COVID-19 pandemic and e-commerce growth fueled the international express service market, as consumers ordered more online. Partnerships between courier companies and e-commerce players are becoming more common in the region to provide international express delivery services. For instance, DHL announced a partnership with BigCommerce, an e-commerce platform for fast-growing and established B2C and B2B brands, to help online business owners expand their portfolio of products worldwide. As of 2022, only 3% of e-commerce revenue was from cross-border transactions in the United States and Canada. Whereas in Mexico, cross-border accounted for 5% of e-commerce revenue. Over the upcoming years, cross-border B2C e-commerce in North America is expected to expand gradually.
- International express services for medical devices have been increasing due to several factors, including increasing demand for faster and more convenient healthcare services. North America (especially the US) dominates the global medical courier market due to the presence of some of the biggest healthcare courier service providers. International express delivery services for healthcare products are expected to grow in the coming years.
Globally growing international express delivery services owing to increasing demand, cross-border trade, and rising e-commerce
- The United States dominates the market in North America. Major retailers in the United States provide international same-day and express delivery, specifically via air cargo, to more than 200 locations globally, as 67% of Americans expected same-day delivery in 2021. Retailers are able to pick up some deliveries under 60 minutes for international same-day delivery shipping. Some companies operated more than 2,000 daily flights specifically to facilitate same-day and time-sensitive deliveries as of 2022. FedEx, DHL, and UPS are some of the main retailers providing these services.
- In 2022, Germany's textile and clothing trade drove demand for international express services. Germany exported textiles worth USD 40.8 billion and imported goods worth over USD 62.5 billion. China was the top clothing trading partner, and Switzerland was the major export market. Also, France's perfumes and cosmetics trade created significant demand. Imports from the United States alone played a crucial role, valued at USD 57 billion, in generating demand for international express services.
- International express demand has also been significant in countries like China and India. For instance, the volume of intra-city, long-distance, and international/Hong Kong, Macao, and Taiwan express delivery business accounted for 11.6%, 86.6%, and 1.8% of the total express delivery business volume, respectively. ASL in India restarted Quikjet as demand for next-day and same-day air transport increased. Amazon Air launched an air cargo service in India in 2023. The aim is to speed up deliveries, for which it invested in Quikjet to transport packages for Amazon across four major Indian cities exclusively. Amazon Air has 110 jets that reach 70 locations worldwide.
Global International Express Service Market Trends
The North American transportation and storage market increased to 21.35% in 2022, valued at USD 642.60 billion, with investment boost
- Asia Pacific is experiencing increased demand for transportation, especially in shipping, which handles a significant portion of global seaborne trade. This region boasts nine of the world's busiest container ports and accounts for more than 40% of global surface freight transport. By 2050, freight transport demand in the region is projected to triple. Meanwhile, Germany has become a leader in the transportation and warehousing sector, surpassing France and the United Kingdom, ranking third globally in imports and exports. To improve transportation infrastructure, the German government plans to invest over EUR 12 billion (USD 12.81 billion) in federal highways and about USD 1.81 billion in waterways in 2022.
- Global foreign direct investment (FDI) flows in 2022 fell by 24%, totaling USD 1,286 billion, or a 5% decrease when excluding Luxembourg, compared to the previous year. The United States remained the top destination for FDI inflows, receiving USD 318 billion, followed by China with USD 180 billion, although at lower levels. Cross-border merger and acquisition (M&A) activity slowed down with fewer deals, while the outlook for greenfield investment remained positive.
- Transportation and storage in North America saw a significant growth boost, rising from 14.31% YoY in 2021 to 21.35% YoY in 2022, driven by increased demand for e-commerce warehousing and distribution centers. This growth encompassed various transportation facets, reaching a total value of USD 642.60 billion. In 2022, the US Department of Transportation introduced the Port Infrastructure Development Program, allocating more than USD 703 million for 41 projects in 22 states to improve port capabilities, enhance supply chain reliability, and create job opportunities.
For over a year, Russia's invasion of Ukraine disrupted global crude oil and petroleum product markets
- In 2022, the global average price of gasoline at the pump was USD 1.22 per liter, a 19% increase from the previous year, exceeding pre-COVID-19 levels. Following the 2021 rebound amid economic recovery, 2022 prices hiked following crude oil increase due to supply disruption risk amid war. Gasoline prices in Europe are the highest compared to other regions. Gasoline is particularly expensive in Iceland, Norway, Denmark, Greece, Finland, and the Netherlands at USD 7.6 per gallon.
- The Brent crude oil price rose significantly in the first half of 2022 but generally declined in the second half of the year. The Brent crude oil spot price averaged USD 100 per barrel in 2022. Total OPEC crude oil production fell from an average of 29.2 million b/d in Q3 2022 to 28.6 million b/d in Q4 2022. In 2023, OPEC crude oil production is expected to average 28.9 million barrels per day. Oil prices have peaked since last November as Russia and Saudi Arabia continue to cut 1.3 million barrels daily from their output, even as global demand rises to near-record levels.
- Diesel is produced from crude oil, so prices are closely linked to diesel prices. Diesel prices in the United States and globally increased rapidly in the spring of 2022 because of concerns about global diesel supply. Although crude oil prices declined in the second half of 2022, US diesel futures prices rose again in October 2022 to USD 3.95 per gallon due to seasonal demand and diesel supply concerns for Europe. Russia has been Europe's largest supplier of diesel. In 2023, diesel prices declined in Europe and the United States as Europe has been able to replace most of the diesel it would have imported from Russia with imports from other regions.
International Express Service Industry Overview
The International Express Service Market is fairly consolidated, with the top five companies occupying 71.98%. The major players in this market are DHL Group, FedEx, La Poste Group, SF Express (KEX-SF) and United Parcel Service of America, Inc. (UPS) (sorted alphabetically).
Additional Benefits:
- The market estimate (ME) sheet in Excel format
- 3 months of analyst support
TABLE OF CONTENTS
1 EXECUTIVE SUMMARY & KEY FINDINGS
2 REPORT OFFERS
3 INTRODUCTION
- 3.1 Study Assumptions & Market Definition
- 3.2 Scope of the Study
- 3.3 Research Methodology
4 KEY INDUSTRY TRENDS
- 4.1 Demographics
- 4.2 GDP Distribution By Economic Activity
- 4.3 GDP Growth By Economic Activity
- 4.4 Inflation
- 4.5 Economic Performance And Profile
- 4.5.1 Trends in E-Commerce Industry
- 4.5.2 Trends in Manufacturing Industry
- 4.6 Transport And Storage Sector GDP
- 4.7 Export Trends
- 4.8 Import Trends
- 4.9 Fuel Price
- 4.10 Logistics Performance
- 4.11 Infrastructure
- 4.12 Regulatory Framework
- 4.12.1 Argentina
- 4.12.2 Australia
- 4.12.3 Brazil
- 4.12.4 Canada
- 4.12.5 Chile
- 4.12.6 China
- 4.12.7 Egypt
- 4.12.8 France
- 4.12.9 Germany
- 4.12.10 India
- 4.12.11 Indonesia
- 4.12.12 Italy
- 4.12.13 Japan
- 4.12.14 Malaysia
- 4.12.15 Mexico
- 4.12.16 Netherlands
- 4.12.17 Nigeria
- 4.12.18 Pakistan
- 4.12.19 Philippines
- 4.12.20 Qatar
- 4.12.21 Russia
- 4.12.22 Saudi Arabia
- 4.12.23 South Africa
- 4.12.24 Spain
- 4.12.25 Switzerland
- 4.12.26 Thailand
- 4.12.27 UAE
- 4.12.28 United Kingdom
- 4.12.29 United States
- 4.12.30 Vietnam
- 4.13 Value Chain & Distribution Channel Analysis
5 MARKET SEGMENTATION (includes Market Value in USD, Forecasts up to 2030 and analysis of growth prospects)
- 5.1 Shipment Weight
- 5.1.1 Heavy Weight Shipments
- 5.1.2 Light Weight Shipments
- 5.1.3 Medium Weight Shipments
- 5.2 Route
- 5.2.1 Inter-Region
- 5.2.2 Intra-Region
- 5.3 End User Industry
- 5.3.1 E-Commerce
- 5.3.2 Financial Services (BFSI)
- 5.3.3 Healthcare
- 5.3.4 Manufacturing
- 5.3.5 Primary Industry
- 5.3.6 Wholesale and Retail Trade (Offline)
- 5.3.7 Others
- 5.4 Region
- 5.4.1 Africa
- 5.4.1.1 By Country
- 5.4.1.1.1 Egypt
- 5.4.1.1.2 Nigeria
- 5.4.1.1.3 South Africa
- 5.4.1.1.4 Rest of Africa
- 5.4.2 Asia Pacific
- 5.4.2.1 By Country
- 5.4.2.1.1 Australia
- 5.4.2.1.2 China
- 5.4.2.1.3 India
- 5.4.2.1.4 Indonesia
- 5.4.2.1.5 Japan
- 5.4.2.1.6 Malaysia
- 5.4.2.1.7 Pakistan
- 5.4.2.1.8 Philippines
- 5.4.2.1.9 Thailand
- 5.4.2.1.10 Vietnam
- 5.4.2.1.11 Rest of Asia Pacific
- 5.4.3 Europe
- 5.4.3.1 By Country
- 5.4.3.1.1 Albania
- 5.4.3.1.2 Bulgaria
- 5.4.3.1.3 Croatia
- 5.4.3.1.4 Czech Republic
- 5.4.3.1.5 Denmark
- 5.4.3.1.6 Estonia
- 5.4.3.1.7 Finland
- 5.4.3.1.8 France
- 5.4.3.1.9 Germany
- 5.4.3.1.10 Hungary
- 5.4.3.1.11 Iceland
- 5.4.3.1.12 Italy
- 5.4.3.1.13 Latvia
- 5.4.3.1.14 Lithuania
- 5.4.3.1.15 Netherlands
- 5.4.3.1.16 Norway
- 5.4.3.1.17 Poland
- 5.4.3.1.18 Romania
- 5.4.3.1.19 Russia
- 5.4.3.1.20 Slovak Republic
- 5.4.3.1.21 Slovenia
- 5.4.3.1.22 Spain
- 5.4.3.1.23 Sweden
- 5.4.3.1.24 Switzerland
- 5.4.3.1.25 United Kingdom
- 5.4.3.1.26 Rest of Europe
- 5.4.4 GCC
- 5.4.4.1 By Country
- 5.4.4.1.1 Qatar
- 5.4.4.1.2 Saudi Arabia
- 5.4.4.1.3 UAE
- 5.4.4.1.4 Rest of GCC
- 5.4.5 North America
- 5.4.5.1 By Country
- 5.4.5.1.1 Canada
- 5.4.5.1.2 Mexico
- 5.4.5.1.3 United States
- 5.4.5.1.4 Rest of North America
- 5.4.6 South America
- 5.4.6.1 By Country
- 5.4.6.1.1 Argentina
- 5.4.6.1.2 Brazil
- 5.4.6.1.3 Chile
- 5.4.6.1.4 Rest of South America
- 5.4.7 Rest of the World
- 5.4.1 Africa
6 COMPETITIVE LANDSCAPE
- 6.1 Key Strategic Moves
- 6.2 Market Share Analysis
- 6.3 Company Landscape
- 6.4 Company Profiles
- 6.4.1 Aramex
- 6.4.2 CJ Logistics Corporation
- 6.4.3 DHL Group
- 6.4.4 FedEx
- 6.4.5 International Distributions Services (including GLS)
- 6.4.6 Kintetsu Group Holdings
- 6.4.7 La Poste Group
- 6.4.8 Otto GmbH & Co. KG
- 6.4.9 SF Express (KEX-SF)
- 6.4.10 SG Holdings Co., Ltd.
- 6.4.11 Toll Group
- 6.4.12 United Parcel Service of America, Inc. (UPS)
7 KEY STRATEGIC QUESTIONS FOR CEP CEOS
8 APPENDIX
- 8.1 Global Overview
- 8.1.1 Overview
- 8.1.2 Porter's Five Forces Framework
- 8.1.3 Global Value Chain Analysis
- 8.1.4 Market Dynamics (DROs)
- 8.1.5 Technological Advancements
- 8.2 Sources & References
- 8.3 List of Tables & Figures
- 8.4 Primary Insights
- 8.5 Data Pack
- 8.6 Glossary of Terms
02-2729-4219
+886-2-2729-4219
 中國 CEP(快遞包裹):市場佔有率分析、行業趨勢和統計、成長預測(2025-2030 年)
 中歐和東歐快遞、快遞和包裹 (CEP):市場佔有率分析、行業趨勢和統計、成長預測(2025-2030 年)
 亞太國際快遞服務:市場佔有率分析、產業趨勢與成長預測(2025-2030 年)
 亞太地區國內宅配-市場佔有率分析、產業趨勢與統計、成長預測(2025-2030 年)
 北美國際快遞服務:市場佔有率分析、產業趨勢與成長預測(2025-2030 年)
 北美快遞包裹 (CEP):市場佔有率分析、行業趨勢和統計、成長預測(2025-2030 年)
 南美快遞、快遞、包裹 (CEP):市場佔有率分析、行業趨勢和統計、成長預測(2025-2030 年)
 印尼 CEP(快遞包裹):市場佔有率分析、行業趨勢和統計、成長預測(2025-2030 年)
 印度國際快遞服務 -市場佔有率分析、產業趨勢與統計、成長預測(2025-2030)
 德國快遞包裹 (CEP):市場佔有率分析、行業趨勢和統計、成長預測(2025-2030 年)
▼