


 |
市場調查報告書
商品編碼
1685834
亞太工程塑膠:市場佔有率分析、產業趨勢與統計、成長預測(2024-2029 年)Asia-pacific Engineering Plastics - Market Share Analysis, Industry Trends & Statistics, Growth Forecasts (2024 - 2029) |
||||||
價格
※ 本網頁內容可能與最新版本有所差異。詳細情況請與我們聯繫。
簡介目錄
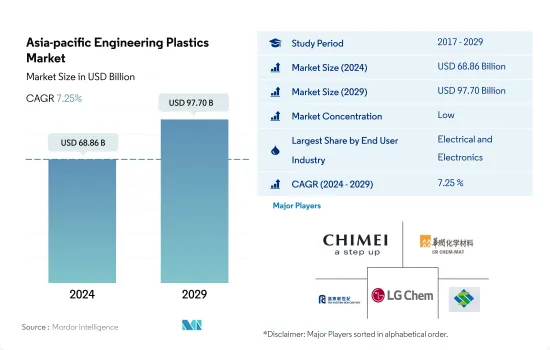
亞太工程塑膠市場規模預計在 2024 年為 688.6 億美元,預計到 2029 年將達到 977 億美元,預測期內(2024-2029 年)的複合年成長率為 7.25%。
包裝業的銷售佔有率被電氣和電子行業奪走
- 工程塑膠用途廣泛,廣泛應用於從航太內牆板和門到剛性和軟性包裝等各種領域。亞太工程塑膠市場主要受包裝、電氣電子和汽車產業推動。到 2022 年,包裝將佔整個工程塑膠市場的約 43.80%,而電氣和電子將佔 31.32%。
- 2020年,受全球供應鏈中斷影響,各產業消費收益較去年與前一年同期比較下降6.02%。然而,2021年市場有所復甦,2022年持續穩定成長,成長率達7.18%。
- 從產量佔有率來看,包裝產業是該地區最大的終端用戶產業。然而,收益資料顯示,由於 PET 在其他工程塑膠中價格相對較低,且廣泛用於包裝應用,因此電氣和電子行業在該地區佔據了最大的佔有率。都市化和家庭結構的重大變化正在增加對功能性、包裝性和簡便食品的需求。例如,亞太地區塑膠包裝產量2022年將達6,800萬噸,佔全球整體的51%。
- 電氣和電子產業是最有前景的市場,預測期內(2023-2029 年)的收益和預計複合年成長率為 8.21%。受智慧電子設備、電動車、自動機器人和先進國防技術需求不斷成長的推動,該地區的電子元件生產收入預計到 2029 年將達到 6.74 兆美元。
中國和日本仍是最大的需求國
- 2022 年,亞太地區將佔全球工程塑膠消費量的 56.7%。工程塑膠具有高度多功能的特性,可應用於汽車、包裝、電氣和電子等各行業。
- 由於採用電氣電子、包裝和汽車等行業的不斷發展,中國是該地區最大的工程塑膠消費國。 2022年中國電子電氣產業佔全部區域收益佔有率為29.26%。 2022年中國電氣及電子元件生產收益將達29.2億美元。
- 日本是該地區第二大工程塑膠消費國。由於建築業和電氣電子行業的快速發展,該國在 2022 年的銷售佔有率達到 8.29%。 2022年,日本建設產業新占地面積成長率為2021年7.47%,2022年4.11%。由於電氣和電子零件產量增加,預計未來該國對工程塑膠的需求將會增加。
- 由於汽車、電子等行業的快速成長,預計中國將成為亞太地區工程塑膠市場成長最快的國家,預測期內以金額為準為 7.50%。自2022年起,中國將取消乘用車製造業外商投資限制,允許中國政府與汽車工程公司以最高50:50的比例組成合資企業。這項變更將透過增加投資為中國汽車產業創造成長機會。
亞太工程塑膠市場趨勢
東南亞國協快速發展帶動電子產品生產
- 在亞太地區,2020年至2021年電氣和電子設備生產收入成長了13.9%。電子業佔大多數亞洲國家出口總額的20-50%。大多數的消費性電子產品,例如電視、收音機、電腦和行動電話,都是在東協地區生產。
- 東協是硬碟生產的領先者,超過80%的硬碟都在該地區生產。整體而言,東協電氣電子產業比其他產業更依賴外國投入和技術,53%的電氣電子出口來自東協電氣電子出口中的外國增加價值或外國投入。
- 泰國和馬來西亞等國家引領該地區的電子產品生產。泰國擁有東南亞最大的電子組裝基地之一,在硬碟、積體電路和半導體生產領域居領先地位。它是全球第二大空調製造商和全球第四大冰箱製造商。
- 電子產業極大地受益於東協的一體化生產網路,這有助於改善與中國和日本等亞洲經濟強國的貿易。
- 中國佔全球電器出口的11.2%,2019年至2020年數位產品出口成長5.8%。亞洲開發銀行稱,中國為該地區的電子產品提供了龐大的市場。泰國、日本、中國、馬來西亞、印度和菲律賓等國家繼續在該地區引領電子產品生產。
亞太工程塑膠產業概況
亞太工程塑膠市場較為分散,前五大公司佔了22.59%的市場。該市場的主要企業為:奇美電子、華潤(集團)、遠東新世紀股份有限公司、LG化學和三豐集團(按字母順序排列)。
其他福利
- Excel 格式的市場預測 (ME) 表
- 3 個月的分析師支持
目錄
第 1 章執行摘要和主要發現
第2章 報告要約
第 3 章 簡介
- 研究假設和市場定義
- 研究範圍
- 調查方法
第4章 產業主要趨勢
- 最終用戶趨勢
- 航太
- 車
- 建築和施工
- 電氣和電子
- 包裝
- 進出口趨勢
- 氟樹脂交易
- 聚醯胺(PA)貿易
- 聚碳酸酯(PC)貿易
- 聚對苯二甲酸乙二酯(PET)貿易
- 聚甲基丙烯酸甲酯(PMMA)貿易
- 聚甲醛(POM)貿易
- 苯乙烯共聚物(ABS 和 SAN)貿易
- 價格趨勢
- 回收概述
- 聚醯胺 (PA) 回收趨勢
- 聚碳酸酯 (PC) 回收趨勢
- 聚對苯二甲酸乙二醇酯 (PET) 的回收趨勢
- 苯乙烯共聚物(ABS、SAN)的回收趨勢
- 法律規範
- 澳洲
- 中國
- 印度
- 日本
- 馬來西亞
- 韓國
- 價值鏈與通路分析
第5章 市場區隔
- 最終用戶產業
- 航太
- 車
- 建築和施工
- 電氣和電子
- 工業/機械
- 包裝
- 其他最終用戶產業
- 樹脂類型
- 氟樹脂
- 依亞型
- 乙烯-四氟乙烯(ETFE)
- 氟化乙丙烯 (FEP)
- 聚四氟乙烯(PTFE)
- 聚氟乙烯 (PVF)
- 聚二氟亞乙烯(PVDF)
- 其他子樹脂類型
- 液晶聚合物(LCP)
- 聚醯胺(PA)
- 副樹脂類型
- 芳香聚醯胺
- 聚醯胺(PA)6
- 聚醯胺(PA)66
- 聚鄰苯二甲醯胺
- 聚丁烯對苯二甲酸酯(PBT)
- 聚碳酸酯(PC)
- 聚醚醚酮 (PEEK)
- 聚對苯二甲酸乙二醇酯(PET)
- 聚醯亞胺(PI)
- 聚甲基丙烯酸甲酯 (PMMA)
- 聚甲醛(POM)
- 苯乙烯共聚物(ABS 和 SAN)
- 氟樹脂
- 國家
- 澳洲
- 中國
- 印度
- 日本
- 馬來西亞
- 韓國
- 其他亞太地區
第6章 競爭格局
- 主要策略趨勢
- 市場佔有率分析
- 業務狀況
- 公司簡介.
- Asahi Kasei Corporation
- CHIMEI
- China Petroleum & Chemical Corporation
- China Resources(Holdings)Co.,Ltd.
- Covestro AG
- Far Eastern New Century Corporation
- Formosa Plastics Group
- LG Chem
- Lotte Chemical
- Mitsubishi Chemical Corporation
- Sanfame Group
- Sinochem
- Solvay
- Sumitomo Chemical Co., Ltd.
- Toray Industries, Inc.
第7章:執行長的關鍵策略問題
第 8 章 附錄
- 世界概況
- 概述
- 五力分析框架(產業吸引力分析)
- 全球價值鏈分析
- 市場動態(DRO)
- 資訊來源和進一步閱讀
- 圖片列表
- 關鍵見解
- 資料包
- 詞彙表
簡介目錄
Product Code: 48295
The Asia-pacific Engineering Plastics Market size is estimated at 68.86 billion USD in 2024, and is expected to reach 97.70 billion USD by 2029, growing at a CAGR of 7.25% during the forecast period (2024-2029).
Packaging industry to lose its volume share to electrical and electronics industry
- Engineering plastics are versatile, finding applications in everything from interior wall panels and doors in aerospace to rigid and flexible packaging. The Asia-Pacific engineering plastics market is primarily driven by the packaging, electrical and electronics, and automotive industries. In 2022, packaging and electrical and electronics accounted for approximately 43.80% and 31.32% of the total engineering plastics market volume, respectively.
- In 2020, the combined consumption revenue across all industries fell by 6.02% compared to the previous year due to disruptions in the global supply chain. However, the market recovered in 2021 and continued to grow steadily, increasing by 7.18% in 2022.
- The packaging industry is the largest end-user industry in the region in terms of volume share. However, according to revenue data, the electrical and electronics industry holds the largest share in the region due to the relatively low price of PET, among other engineering plastics, which are widely used in packaging applications. Significant changes in urbanization and family demographics have increased the demand for functional, prepackaged, and convenient food products. For instance, Asia-Pacific plastic packaging production reached a volume of 68 million tons in 2022, accounting for 51% of the global total.
- The electrical and electronic industry is the most promising market, with an expected CAGR of 8.21% by revenue during the forecast period (2023-2029). Electronics component production revenue in the region is projected to reach USD 6.74 trillion by 2029, driven by the increasing demand for smart electronic devices, the growing demand for electric vehicles, autonomous robots, and advanced defense technologies.
China and Japan to remain as largest demand generators
- Asia-Pacific accounted for 56.7% by volume of the consumption of engineering plastics globally in 2022. Engineering plastics exhibit versatile properties due to which they find applications in various industries, such as automotive, packaging, and electrical and electronics.
- China is the largest consumer of engineering plastics in the region owing to its growing electrical and electronics, packaging, automotive, and other industries. In 2022, the Chinese electrical and electronics industry held a revenue share of 29.26% compared to the overall Asia-Pacific region. In China, the revenue from electrical and electronic component production accounted for USD 2.92 billion in 2022.
- Japan is the second-largest consumer of engineering plastics in the region. The country registered a revenue share of 8.29% in 2022 due to its rapidly growing construction and electrical and electronics industries. In 2022, the new construction floor area of the Japanese building and construction industry increased at a rate of 7.47% and 4.11% in 2021 and 2022 by revenue, respectively. The rising electrical and electronics component production is projected to drive the demand for engineering plastics in the country in the future.
- China is expected to witness the fastest growth in the Asia-Pacific engineering plastics market, with a CAGR of 7.50% in terms of value during the forecast period, owing to the rapid growth of industries like automotive and electronics. From 2022 onward, China lifted the restrictions on foreign investment in passenger car manufacturing, allowing for maximum investment in joint ventures between the Chinese government and automotive engineering companies to reach a 50:50 ratio. This change presents an opportunity for growth in the Chinese automotive industry through increased investment.
Asia-pacific Engineering Plastics Market Trends
Rapid growth in ASEAN countries to foster electronics production
- The Asia-Pacific region saw an increase in electrical and electronics production revenue by 13.9% from 2020 to 2021. The electronics sector accounts for 20-50% of the total value of most Asian countries' exports. Consumer electronics such as televisions, radios, computers, and cellular phones are largely manufactured in the ASEAN region.
- ASEAN leads the production of hard drives, with over 80% of hard drives being manufactured in the region. Overall, the electrical and electronics (E&E) industry in ASEAN relies more on foreign inputs and technology than other industries, with 53% of E&E exports arising from foreign value added (FVA) or foreign inputs integrated into ASEAN's E&E exports.
- Countries like Thailand and Malaysia lead in the production of electronics in the region. Thailand, home to one of the largest electronics assembly bases in Southeast Asia, leads in the production of hard drives, integrated circuits, and semiconductors. It ranks second in manufacturing air conditioning units and fourth in the global refrigerators market.
- The electronics industry has greatly benefitted from ASEAN's integrated production networks, which foster improved trade with larger Asian economies like China and Japan.
- China held an 11.2% share of global exports in electrical products and registered a growth of 5.8% in the export of digital products from 2019 to 2020. According to the Asian Development Bank, China provides a large market for electronics in the region. Countries such as Thailand, Japan, China, Malaysia, India, and the Philippines continue to lead the region in the production of electronics.
APAC Engineering Plastics Industry Overview
The Asia-pacific Engineering Plastics Market is fragmented, with the top five companies occupying 22.59%. The major players in this market are CHIMEI, China Resources (Holdings) Co.,Ltd., Far Eastern New Century Corporation, LG Chem and Sanfame Group (sorted alphabetically).
Additional Benefits:
- The market estimate (ME) sheet in Excel format
- 3 months of analyst support
TABLE OF CONTENTS
1 EXECUTIVE SUMMARY & KEY FINDINGS
2 REPORT OFFERS
3 INTRODUCTION
- 3.1 Study Assumptions & Market Definition
- 3.2 Scope of the Study
- 3.3 Research Methodology
4 KEY INDUSTRY TRENDS
- 4.1 End User Trends
- 4.1.1 Aerospace
- 4.1.2 Automotive
- 4.1.3 Building and Construction
- 4.1.4 Electrical and Electronics
- 4.1.5 Packaging
- 4.2 Import And Export Trends
- 4.2.1 Fluoropolymer Trade
- 4.2.2 Polyamide (PA) Trade
- 4.2.3 Polycarbonate (PC) Trade
- 4.2.4 Polyethylene Terephthalate (PET) Trade
- 4.2.5 Polymethyl Methacrylate (PMMA) Trade
- 4.2.6 Polyoxymethylene (POM) Trade
- 4.2.7 Styrene Copolymers (ABS and SAN) Trade
- 4.3 Price Trends
- 4.4 Recycling Overview
- 4.4.1 Polyamide (PA) Recycling Trends
- 4.4.2 Polycarbonate (PC) Recycling Trends
- 4.4.3 Polyethylene Terephthalate (PET) Recycling Trends
- 4.4.4 Styrene Copolymers (ABS and SAN) Recycling Trends
- 4.5 Regulatory Framework
- 4.5.1 Australia
- 4.5.2 China
- 4.5.3 India
- 4.5.4 Japan
- 4.5.5 Malaysia
- 4.5.6 South Korea
- 4.6 Value Chain & Distribution Channel Analysis
5 MARKET SEGMENTATION (includes market size in Value in USD and Volume, Forecasts up to 2029 and analysis of growth prospects)
- 5.1 End User Industry
- 5.1.1 Aerospace
- 5.1.2 Automotive
- 5.1.3 Building and Construction
- 5.1.4 Electrical and Electronics
- 5.1.5 Industrial and Machinery
- 5.1.6 Packaging
- 5.1.7 Other End-user Industries
- 5.2 Resin Type
- 5.2.1 Fluoropolymer
- 5.2.1.1 By Sub Resin Type
- 5.2.1.1.1 Ethylenetetrafluoroethylene (ETFE)
- 5.2.1.1.2 Fluorinated Ethylene-propylene (FEP)
- 5.2.1.1.3 Polytetrafluoroethylene (PTFE)
- 5.2.1.1.4 Polyvinylfluoride (PVF)
- 5.2.1.1.5 Polyvinylidene Fluoride (PVDF)
- 5.2.1.1.6 Other Sub Resin Types
- 5.2.2 Liquid Crystal Polymer (LCP)
- 5.2.3 Polyamide (PA)
- 5.2.3.1 By Sub Resin Type
- 5.2.3.1.1 Aramid
- 5.2.3.1.2 Polyamide (PA) 6
- 5.2.3.1.3 Polyamide (PA) 66
- 5.2.3.1.4 Polyphthalamide
- 5.2.4 Polybutylene Terephthalate (PBT)
- 5.2.5 Polycarbonate (PC)
- 5.2.6 Polyether Ether Ketone (PEEK)
- 5.2.7 Polyethylene Terephthalate (PET)
- 5.2.8 Polyimide (PI)
- 5.2.9 Polymethyl Methacrylate (PMMA)
- 5.2.10 Polyoxymethylene (POM)
- 5.2.11 Styrene Copolymers (ABS and SAN)
- 5.2.1 Fluoropolymer
- 5.3 Country
- 5.3.1 Australia
- 5.3.2 China
- 5.3.3 India
- 5.3.4 Japan
- 5.3.5 Malaysia
- 5.3.6 South Korea
- 5.3.7 Rest of Asia-Pacific
6 COMPETITIVE LANDSCAPE
- 6.1 Key Strategic Moves
- 6.2 Market Share Analysis
- 6.3 Company Landscape
- 6.4 Company Profiles (includes Global Level Overview, Market Level Overview, Core Business Segments, Financials, Headcount, Key Information, Market Rank, Market Share, Products and Services, and Analysis of Recent Developments).
- 6.4.1 Asahi Kasei Corporation
- 6.4.2 CHIMEI
- 6.4.3 China Petroleum & Chemical Corporation
- 6.4.4 China Resources (Holdings) Co.,Ltd.
- 6.4.5 Covestro AG
- 6.4.6 Far Eastern New Century Corporation
- 6.4.7 Formosa Plastics Group
- 6.4.8 LG Chem
- 6.4.9 Lotte Chemical
- 6.4.10 Mitsubishi Chemical Corporation
- 6.4.11 Sanfame Group
- 6.4.12 Sinochem
- 6.4.13 Solvay
- 6.4.14 Sumitomo Chemical Co., Ltd.
- 6.4.15 Toray Industries, Inc.
7 KEY STRATEGIC QUESTIONS FOR ENGINEERING PLASTICS CEOS
8 APPENDIX
- 8.1 Global Overview
- 8.1.1 Overview
- 8.1.2 Porter's Five Forces Framework (Industry Attractiveness Analysis)
- 8.1.3 Global Value Chain Analysis
- 8.1.4 Market Dynamics (DROs)
- 8.2 Sources & References
- 8.3 List of Tables & Figures
- 8.4 Primary Insights
- 8.5 Data Pack
- 8.6 Glossary of Terms
02-2729-4219
+886-2-2729-4219
 中國工程塑膠:市場佔有率分析、產業趨勢與統計、成長預測(2024-2029)北美工程塑膠:市場佔有率分析、行業趨勢和統計、成長預測(2024-2029 年)南美工程塑膠:市場佔有率分析、行業趨勢和統計、成長預測(2024-2029 年)工程塑膠:市場佔有率分析、產業趨勢和成長預測(2024-2029)德國工程塑膠:市場佔有率分析、行業趨勢和統計、成長預測(2024-2029 年)歐洲工程塑膠:市場佔有率分析、行業趨勢和統計、成長預測(2024-2029 年)法國工程塑膠市場:佔有率分析、產業趨勢和成長預測(2025-2030 年)
 全球工程塑膠市場:成長、未來展望與競爭分析(2025-2033)
 聚甲醛(聚甲醛,POM)市場報告:趨勢、預測與競爭分析(至 2031 年)
 工程塑膠市場按產品類型、應用和地區分類
▼