


 |
市場調查報告書
商品編碼
1685843
北美工程塑膠:市場佔有率分析、行業趨勢和統計、成長預測(2024-2029 年)North America Engineering Plastics - Market Share Analysis, Industry Trends & Statistics, Growth Forecasts (2024 - 2029) |
||||||
※ 本網頁內容可能與最新版本有所差異。詳細情況請與我們聯繫。
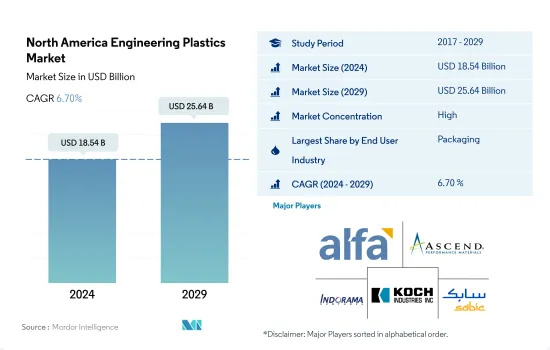
北美工程塑膠市場規模預計在 2024 年將達到 185.4 億美元,預計到 2029 年將達到 256.4 億美元,預測期內(2024-2029 年)的複合年成長率為 6.70%。
包裝業的銷售佔有率被電氣和電子行業奪走
- 工程塑膠的應用範圍包括航太內牆板和門以及硬質和軟質包裝。北美工程塑膠市場受到包裝、電氣電子和汽車等行業的推動。 2022年工程塑膠市場銷售額中包裝佔比約31.35%,電子電氣佔比約17.43%。
- 由於家庭規模變小、都市化以及全球家庭人口結構發生重大變化,包裝已成為該地區最大的終端用戶產業。這些因素推動了對功能性、預先預包裝和簡便食品的需求。 2022年北美塑膠包裝產量為2,240萬噸,佔全球整體的16.6%。由於消費者對包裝食品和飲料的需求不斷增加,該地區對工程塑膠的需求也在增加。
- 電氣和電子行業是該地區第二大行業,尤其是在美國。該產業佔國內生產毛額的1.6%。該地區累計2022年的銷售額將達到5,761億美元,這將推動對電氣和電子設備的需求不斷成長,並支持電動車、自動機器人和秘密防禦技術的出現,從而推動對工程塑膠的需求。
- 電氣和電子產業是該地區成長最快的產業,預測期內(2023-2029 年)預計收益和複合年成長率將達到 8.54%,這歸因於各種電氣和電子應用對塑膠複合材料的需求導致工程塑膠的使用不斷增加。
不斷變化的消費者和工業趨勢加上技術創新可能會推動對工程塑膠的需求。
- 2022 年,北美佔全球工程塑膠消費佔有率的 15%。工程塑膠具有多種性能,可應用於汽車、包裝、電氣和電子產業。
- 美國在 2022 年的以金額為準年增 7.14%,與前一年同期比較得益於包裝和電氣電子產業的推動,這兩個以金額為準的市場佔有率分別佔 27% 和 24%。即食簡便食品的需求不斷成長以及新興的忙碌生活方式趨勢正在推動包裝材料消費量的成長,從而推動該地區工程塑膠的銷售趨勢。隨著公司採用在家工作模式且人們設立家庭辦公室,對電子設備的需求也隨之增加。技術創新也每年創造對電子設備的穩定需求。
- 墨西哥是成長最快的市場,2022 年的以金額為準與 2021 年相比成長了 10.53%,其中工業機械和設備產業佔據主導地位。墨西哥希望透過建造高速公路、現代化港口和機械化農場來實現擴張,從而推動施工機械和農業機械的需求。
- 預測期內,北美工程塑膠市場預計複合年成長率為 6.62%,其中電氣和電子產業以金額為準複合年成長率最高,為 8.54%。先進材料、有機電子、小型化以及人工智慧和物聯網等顛覆性技術的使用也可能推動智慧製造方法的採用,從而推動產業成長。
北美工程塑膠市場趨勢
技術創新強勁成長推動整個產業的成長
- 由於技術進步以及智慧電視、冰箱和空調等家用電器的需求不斷增加,2017 年至 2019 年北美電氣和電子設備產量的複合年成長率超過 1.4%。電子創新的快速步伐推動著對更新、更快的電子產品的需求。因此,該地區的電氣和電子設備產量也在增加。
- 由於受新冠疫情的影響,生產設施關閉、供應鏈中斷以及各種其他限制因素,2020 年北美電子產品銷售額與 2019 年相比下降了約 9%。結果,該地區2020年電氣和電子設備生產收益與前一年同期比較下降了4.7%。
- 2021年該地區的消費性電子產品銷售額將達到約1,130億美元,較2020年成長4%。因此,2021年北美電氣和電子設備產量與前一年同期比較增13.8%。
- 到 2027 年,北美預計將成為電氣和電子設備生產的第三大地區,佔全球市場佔有率的約 10.5%。虛擬實境、物聯網解決方案和機器人等先進技術在家用電器中的應用,提高了效率並降低了成本,為家電產業帶來了巨大利益。該地區的家電產業市場規模預計將從 2023 年的 1,276 億美元成長到 2027 年的約 1,618 億美元。因此,該地區對電氣和電子產品的需求預計將會增加。
北美工程塑膠行業概況
北美工程塑膠市場相當集中,前五大公司佔68.68%的市佔率。市場的主要企業是:Alfa SAB de CV、Ascend Performance Materials、Indorama Ventures Public Company Limited、Koch Industries, Inc. 和 SABIC(按字母順序排列)。
其他福利
- Excel 格式的市場預測 (ME) 表
- 3 個月的分析師支持
目錄
第 1 章執行摘要和主要發現
第2章 報告要約
第 3 章 簡介
- 研究假設和市場定義
- 研究範圍
- 調查方法
第4章 產業主要趨勢
- 最終用戶趨勢
- 航太
- 車
- 建築和施工
- 電氣和電子
- 包裝
- 進出口趨勢
- 氟樹脂交易
- 聚醯胺(PA)貿易
- 聚碳酸酯(PC)貿易
- 聚對苯二甲酸乙二酯(PET)貿易
- 聚甲基丙烯酸甲酯(PMMA)貿易
- 聚甲醛(POM)貿易
- 苯乙烯共聚物(ABS 和 SAN)貿易
- 價格趨勢
- 回收概述
- 聚醯胺 (PA) 回收趨勢
- 聚碳酸酯 (PC) 回收趨勢
- 聚對苯二甲酸乙二醇酯 (PET) 的回收趨勢
- 苯乙烯共聚物(ABS、SAN)的回收趨勢
- 法律規範
- 加拿大
- 墨西哥
- 美國
- 價值鏈與通路分析
第5章 市場區隔
- 最終用戶產業
- 航太
- 車
- 建築和施工
- 電氣和電子
- 工業/機械
- 包裝
- 其他最終用戶產業
- 樹脂類型
- 氟樹脂
- 依亞型
- 乙烯-四氟乙烯(ETFE)
- 氟化乙丙烯 (FEP)
- 聚四氟乙烯(PTFE)
- 聚氟乙烯 (PVF)
- 聚二氟亞乙烯(PVDF)
- 其他子樹脂類型
- 液晶聚合物(LCP)
- 聚醯胺(PA)
- 依樹脂類型分
- 芳香聚醯胺
- 聚醯胺(PA)6
- 聚醯胺(PA)66
- 聚鄰苯二甲醯胺
- 聚丁烯對苯二甲酸酯(PBT)
- 聚碳酸酯(PC)
- 聚醚醚酮 (PEEK)
- 聚對苯二甲酸乙二醇酯(PET)
- 聚醯亞胺(PI)
- 聚甲基丙烯酸甲酯 (PMMA)
- 聚甲醛(POM)
- 苯乙烯共聚物(ABS 和 SAN)
- 氟樹脂
- 國家
- 加拿大
- 墨西哥
- 美國
第6章 競爭格局
- 主要策略趨勢
- 市場佔有率分析
- 業務狀況
- 公司簡介.
- Alfa SAB de CV
- Arkema
- Ascend Performance Materials
- BASF SE
- Celanese Corporation
- Covestro AG
- DuPont
- Eastman Chemical Company
- Formosa Plastics Group
- Indorama Ventures Public Company Limited
- INEOS
- Koch Industries, Inc.
- SABIC
- Solvay
- Trinseo
第7章:執行長的關鍵策略問題
第 8 章 附錄
- 世界概況
- 概述
- 五力分析框架(產業吸引力分析)
- 全球價值鏈分析
- 市場動態(DRO)
- 資訊來源和進一步閱讀
- 圖片列表
- 關鍵見解
- 資料包
- 詞彙表
The North America Engineering Plastics Market size is estimated at 18.54 billion USD in 2024, and is expected to reach 25.64 billion USD by 2029, growing at a CAGR of 6.70% during the forecast period (2024-2029).
Packaging industry to lose some of its volume share to electrical and electronics industry
- Engineering plastics have applications ranging from interior wall panels and doors in aerospace to rigid and flexible packaging. The North American engineering plastics market is led by industries such as packaging, electrical and electronics, and automotive. Packaging and electrical and electronics accounted for around 31.35% and 17.43%, respectively, of the engineering plastics market in terms of revenue in 2022.
- Packaging is the largest end-user industry in the region due to families worldwide becoming smaller and significant changes in urbanization and family demographics. These factors increase the demand for functional, prepackaged, and convenient food products. Plastic packaging production in North America had a volume of 22.4 million tons in 2022, which was 16.6% globally. The demand for engineering plastics in the region is increasing due to the increasing consumer demand for packaged food and beverages.
- The electrical and electronics sector is the second largest in the region and especially in the United States. The sector accounted for 1.6% of the GDP. It generated a revenue of USD 576.1 billion in 2022 in the region, thus increasing the demand for electrical and electronics and empowering the onset of electric vehicles, autonomous robots, and top-secret defense technologies, thereby boosting the demand for engineering plastics.
- The electrical and electronics industry is the fastest-growing in the region by revenue, with an expected CAGR of 8.54% during the forecast period (2023-2029), due to increasing applications of engineering plastics for the need of plastic composites in various electrical and electronics applications.
Evolving consumer and industrial trends, coupled with technological innovations, may boost the demand for engineering plastics
- North America accounted for a 15% consumption share of engineering plastics globally in 2022. Engineering plastics exhibit versatile properties, thus finding applications in the automotive, packaging, and electrical and electronics industries.
- The United States recorded a growth of 7.14% by value in 2022 compared to the previous year, attributed to the packaging and electrical and electronics industries, which held 27% and 24% of the market shares, respectively, by value. With an increase in the demand for ready-to-eat convenience food products and the emerging trend of an on-the-go lifestyle, the consumption of packaging materials has increased, thus boosting the sales of engineering plastics in the region. With companies adopting work-from-home models and people setting up home offices, the demand for electronic devices also increased. Technological innovations are also creating consistent demand for electronic gadgets every year.
- Mexico is the fastest-growing market, recording a growth of 10.53% in terms of value in 2022 compared to 2021, led by the industrial machinery and equipment industry. Mexico aims to improve its highways, modernize its ports, and expand its farms by making them more mechanized, thus boosting the demand for construction and farming machinery.
- The North American engineering plastics market is expected to register a CAGR of 6.62% during the forecast period, with the electrical and electronics industry recording the highest CAGR of 8.54% by value. The use of advanced materials, organic electronics, miniaturization, and disruptive technologies like AI and the IoT may also boost the adoption of smart manufacturing practices, thus driving the industry's growth.
North America Engineering Plastics Market Trends
Strong growth of technological innovations to augment the overall growth of the industry
- Electrical and electronics production in North America witnessed a CAGR of over 1.4% between 2017 and 2019 owing to the advancement of technology, coupled with the increasing demand for consumer electronics products, such as smart TVs, refrigerators, air conditioners, and other products. The rapid pace of electronic technological innovation is driving the demand for newer and faster electronic products. As a result, it has also increased the electrical and electronics production in the region.
- Electronic device sales in North America fell by around 9% in 2020 compared to 2019, owing to the COVID-19 impact, because of the production facility shutdowns, supply chain disruptions, and various other constraints. As a result, revenue from electrical and electronics production in the region decreased by 4.7% in 2020 compared to the previous year.
- In 2021, the sales of consumer electronics in the region reached around USD 113 billion, 4% higher than in 2020. As a result, North America's electrical and electronics production grew by 13.8% in 2021 in terms of revenue compared to the previous year.
- By 2027, North America is projected to be the third-largest region for electrical and electronics production and account for a share of around 10.5% of the global market. The emergence of advanced technologies such as virtual reality, IoT solutions, and robotics into consumer electronic products to achieve efficiency and low cost has provided a significant advantage to the consumer electronics industry. The consumer electronics industry in the region is projected to reach a market volume of around USD 161.8 billion by 2027 from USD 127.6 billion in 2023. As a result, the demand for electrical and electronic products in the region is projected to increase.
North America Engineering Plastics Industry Overview
The North America Engineering Plastics Market is fairly consolidated, with the top five companies occupying 68.68%. The major players in this market are Alfa S.A.B. de C.V., Ascend Performance Materials, Indorama Ventures Public Company Limited, Koch Industries, Inc. and SABIC (sorted alphabetically).
Additional Benefits:
- The market estimate (ME) sheet in Excel format
- 3 months of analyst support
TABLE OF CONTENTS
1 EXECUTIVE SUMMARY & KEY FINDINGS
2 REPORT OFFERS
3 INTRODUCTION
- 3.1 Study Assumptions & Market Definition
- 3.2 Scope of the Study
- 3.3 Research Methodology
4 KEY INDUSTRY TRENDS
- 4.1 End User Trends
- 4.1.1 Aerospace
- 4.1.2 Automotive
- 4.1.3 Building and Construction
- 4.1.4 Electrical and Electronics
- 4.1.5 Packaging
- 4.2 Import And Export Trends
- 4.2.1 Fluoropolymer Trade
- 4.2.2 Polyamide (PA) Trade
- 4.2.3 Polycarbonate (PC) Trade
- 4.2.4 Polyethylene Terephthalate (PET) Trade
- 4.2.5 Polymethyl Methacrylate (PMMA) Trade
- 4.2.6 Polyoxymethylene (POM) Trade
- 4.2.7 Styrene Copolymers (ABS and SAN) Trade
- 4.3 Price Trends
- 4.4 Recycling Overview
- 4.4.1 Polyamide (PA) Recycling Trends
- 4.4.2 Polycarbonate (PC) Recycling Trends
- 4.4.3 Polyethylene Terephthalate (PET) Recycling Trends
- 4.4.4 Styrene Copolymers (ABS and SAN) Recycling Trends
- 4.5 Regulatory Framework
- 4.5.1 Canada
- 4.5.2 Mexico
- 4.5.3 United States
- 4.6 Value Chain & Distribution Channel Analysis
5 MARKET SEGMENTATION (includes market size in Value in USD and Volume, Forecasts up to 2029 and analysis of growth prospects)
- 5.1 End User Industry
- 5.1.1 Aerospace
- 5.1.2 Automotive
- 5.1.3 Building and Construction
- 5.1.4 Electrical and Electronics
- 5.1.5 Industrial and Machinery
- 5.1.6 Packaging
- 5.1.7 Other End-user Industries
- 5.2 Resin Type
- 5.2.1 Fluoropolymer
- 5.2.1.1 By Sub Resin Type
- 5.2.1.1.1 Ethylenetetrafluoroethylene (ETFE)
- 5.2.1.1.2 Fluorinated Ethylene-propylene (FEP)
- 5.2.1.1.3 Polytetrafluoroethylene (PTFE)
- 5.2.1.1.4 Polyvinylfluoride (PVF)
- 5.2.1.1.5 Polyvinylidene Fluoride (PVDF)
- 5.2.1.1.6 Other Sub Resin Types
- 5.2.2 Liquid Crystal Polymer (LCP)
- 5.2.3 Polyamide (PA)
- 5.2.3.1 By Sub Resin Type
- 5.2.3.1.1 Aramid
- 5.2.3.1.2 Polyamide (PA) 6
- 5.2.3.1.3 Polyamide (PA) 66
- 5.2.3.1.4 Polyphthalamide
- 5.2.4 Polybutylene Terephthalate (PBT)
- 5.2.5 Polycarbonate (PC)
- 5.2.6 Polyether Ether Ketone (PEEK)
- 5.2.7 Polyethylene Terephthalate (PET)
- 5.2.8 Polyimide (PI)
- 5.2.9 Polymethyl Methacrylate (PMMA)
- 5.2.10 Polyoxymethylene (POM)
- 5.2.11 Styrene Copolymers (ABS and SAN)
- 5.2.1 Fluoropolymer
- 5.3 Country
- 5.3.1 Canada
- 5.3.2 Mexico
- 5.3.3 United States
6 COMPETITIVE LANDSCAPE
- 6.1 Key Strategic Moves
- 6.2 Market Share Analysis
- 6.3 Company Landscape
- 6.4 Company Profiles (includes Global Level Overview, Market Level Overview, Core Business Segments, Financials, Headcount, Key Information, Market Rank, Market Share, Products and Services, and Analysis of Recent Developments).
- 6.4.1 Alfa S.A.B. de C.V.
- 6.4.2 Arkema
- 6.4.3 Ascend Performance Materials
- 6.4.4 BASF SE
- 6.4.5 Celanese Corporation
- 6.4.6 Covestro AG
- 6.4.7 DuPont
- 6.4.8 Eastman Chemical Company
- 6.4.9 Formosa Plastics Group
- 6.4.10 Indorama Ventures Public Company Limited
- 6.4.11 INEOS
- 6.4.12 Koch Industries, Inc.
- 6.4.13 SABIC
- 6.4.14 Solvay
- 6.4.15 Trinseo
7 KEY STRATEGIC QUESTIONS FOR ENGINEERING PLASTICS CEOS
8 APPENDIX
- 8.1 Global Overview
- 8.1.1 Overview
- 8.1.2 Porter's Five Forces Framework (Industry Attractiveness Analysis)
- 8.1.3 Global Value Chain Analysis
- 8.1.4 Market Dynamics (DROs)
- 8.2 Sources & References
- 8.3 List of Tables & Figures
- 8.4 Primary Insights
- 8.5 Data Pack
- 8.6 Glossary of Terms
 中國工程塑膠:市場佔有率分析、產業趨勢與統計、成長預測(2024-2029)亞太工程塑膠:市場佔有率分析、產業趨勢與統計、成長預測(2024-2029 年)南美工程塑膠:市場佔有率分析、行業趨勢和統計、成長預測(2024-2029 年)工程塑膠:市場佔有率分析、產業趨勢和成長預測(2024-2029)德國工程塑膠:市場佔有率分析、行業趨勢和統計、成長預測(2024-2029 年)歐洲工程塑膠:市場佔有率分析、行業趨勢和統計、成長預測(2024-2029 年)法國工程塑膠市場:佔有率分析、產業趨勢和成長預測(2025-2030 年)
 全球工程塑膠市場:成長、未來展望與競爭分析(2025-2033)
 聚甲醛(聚甲醛,POM)市場報告:趨勢、預測與競爭分析(至 2031 年)
 工程塑膠市場按產品類型、應用和地區分類