


 |
市場調查報告書
商品編碼
1686538
亞太地區作物保護化學品:市場佔有率分析、產業趨勢與統計、成長預測(2025-2030 年)Asia Pacific Crop Protection Chemicals - Market Share Analysis, Industry Trends & Statistics, Growth Forecasts (2025 - 2030) |
||||||
價格
※ 本網頁內容可能與最新版本有所差異。詳細情況請與我們聯繫。
簡介目錄
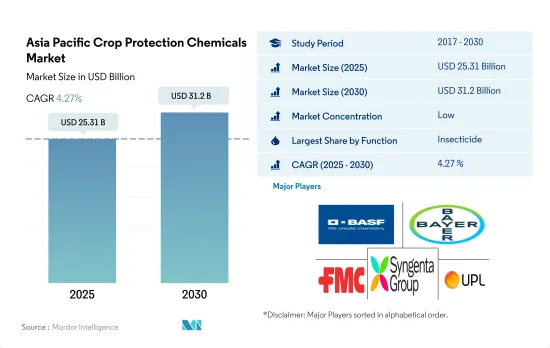
亞太地區作物保護化學品市場規模預計在 2025 年為 253.1 億美元,預計到 2030 年將達到 312 億美元,預測期內(2025-2030 年)的複合年成長率為 4.27%。
由於害蟲和雜草侵襲不斷增加,殺蟲劑和除草劑佔據亞太市場主導地位
- 亞太地區農業種類繁多,在許多國家的經濟中發揮著至關重要的作用。該地區氣候類型多樣,從熱帶到溫帶,以種植水稻、大豆、小麥以及各種水果和蔬菜而聞名。 2022 年,亞太地區佔全球作物保護化學品市場以金額為準的 24.7%。
- 由於該地區人口不斷成長,對作物的需求不斷增加,因此鼓勵使用作物保護化學物質來獲得更好的產量。同時,技術進步正在改變農業生產方式,新的病蟲害防治技術為作物和農民帶來巨大的利益。
- 殺蟲劑在亞太作物保護化學品市場佔有最高佔有率,為50.8%。水稻是許多地區的主要作物。然而,它易受多種害蟲的侵害,從而對作物造成嚴重損害,並最終影響其產量。
- 2022 年,除草劑以以金額為準佔據第二大佔有率,為 28.5%。雜草對作物、作物和園藝作物的破壞對該地區的農業生產力構成了重大挑戰。水果產業對該地區經濟成長貢獻巨大,因此果樹雜草會造成嚴重的經濟損失。反枝莧(紅莧菜)和稗草(稗草)是當地果樹業中最常見的雜草。
- 人們對糧食安全和各種市場機會的日益關注,促使農民有效率且永續生產糧食,同時盡量減少害蟲對作物的影響。這將推動市場的發展,預計預測期內(2023-2029 年)的複合年成長率將達到 4.5%。
由於用於保護作物免受害蟲、疾病和雜草侵害的作物保護化學品的消費量不斷增加,市場正在成長。
- 2022 年,以以金額為準計算,亞太地區在全球殺蟲劑市場佔有 24.7% 的市場佔有率。該地區的農藥產業極為重要且正在不斷發展。它在促進多個國家的高效、永續農業實踐方面發揮關鍵作用。過去一段時間,亞太地區殺蟲劑市場持續成長,複合年成長率為 5.5%。
- 包括中國和印度在內的亞太國家由於農業景觀多樣化,且作物易受病蟲害侵害,因此作物保護化學品的使用量正在增加。作物集約化種植、單一栽培的盛行也為病蟲害的蔓延創造了有利條件。隨著糧食安全成為維持大量人口生存的首要任務,人們越來越需要保護作物產量並儘量減少因病蟲害造成的損失,從而增加了對作物保護化學品的依賴。
- 此外,透過採用現代技術和擴大耕地面積來擴大農業也促進了市場的成長。該地區的農業用地面積預計將從2019年的6.245億公頃擴大到2022年的6.622億公頃。隨著農業活動的擴大,對保護作物免受病蟲害的有效解決方案的需求也在增加。
- 預計在預測期(2023-2029 年),泰國的以金額為準年成長率為 6.8%,是該地區成長率最快的國家。這一激增的原因是,由於病蟲害威脅日益嚴重以及作物損失不斷增加,該國農民預計將增加作物保護化學品的使用。
亞太作物保護化學品市場趨勢
害蟲增多導致作物保護化學物質的使用增加
- 2022年亞太地區作物保護化學品的平均消費量為每公頃農地2.9公斤。殺菌劑是最常用的化學作物保護化學品,平均消費量達每公頃 10.6 公斤。這顯示真菌病原體對農業生產構成重大威脅,因此對殺菌劑的需求日益增加。稻瘟病的病原體已經對 MBI-D 殺菌劑產生了抗藥性,增加了對殺菌劑噴灑的需求。
- 繼殺菌劑之後的是除草劑,2022 年的施用量將達到每公頃 10.4 公斤。每公頃除草劑使用量的增加是由於多種因素造成的,包括農業人口老化、勞動力短缺和農地擴張。這些因素促使人們從手工除草轉向使用除草劑來有效地管理水稻和大豆等重要作物的雜草。此外,雜草對現有除草劑的抵抗力越來越強,使其更難以控制,從而導致除草劑的使用量增加。
- 殺蟲劑將成為亞太國家第三大廣泛使用的作物保護化學品,2022 年施用量將達到每公頃 8 公斤。全球暖化和氣候變遷也透過各種機制增加害蟲數量,對農業生產構成各種挑戰。例如,人們觀察到,隨著氣溫升高,水稻的主要害蟲小褐飛蝨(Nilaparvata lugens)在亞洲部分地區的數量增加,分佈範圍也擴大了。同樣,隨著農民對殺線蟲劑和殺軟體動物劑益處的認知不斷提高和需求不斷增加,其使用也在增加。
Cypermethrin的供應有限和需求導致亞太市場上活性成分的價格上漲。
- Cypermethrin是一種合成擬除蟲菊酯殺蟲劑,主要用於該地區,可有效防治多種害蟲,包括鱗翅目、鞘翅目、雙翅目和半翅目。在印度、中國和越南等國家,Cypermethrin主要用於防治各種作物的害蟲。其中,中國和越南是Cypermethrin的主要進口國。截至 2022 年,該活性成分的價格已上漲至每噸 21,037.7 美元,自 2017 年以來顯著上漲了 21.1%。此次價格上漲是由於甘蔗、棉花、水果和蔬菜等作物對Cypermethrin的需求增加。
- Atrazine是該地區重要且廣泛使用的除草劑,被歸類為三嗪類氯除草劑。Atrazine用作出苗前和出苗後除草劑,可有效控制大豆、玉米、甘蔗、草坪等作物中的一年生闊葉雜草和禾本科雜草。由於該活性成分廣泛應用於多種作物,其價格一直呈現與前一年同期比較成長的趨勢。 2022 年的最新價格為每噸 13,817.2 美元,較 2017 年大幅上漲 29.8%。
- 代森錳鋅是一種接觸性殺菌劑,以其多功能的應用形式而聞名,可有效針對穀物、水果、蔬菜和豆類中的多種真菌疾病。該活性成分目前的價格為每噸 7,776.9 美元,是亞太國家廣泛使用的領先殺菌劑活性成分之一。
- 由於原料成本、進口關稅和物流成本的上漲,活性成分的價格逐年上漲。
亞太地區作物保護化學品產業概況
亞太地區作物保護化學品市場較為分散,前五大公司佔了33.97%的市場。該市場的主要企業是:BASF公司、拜耳公司、FMC 公司、先正達集團和 UPL 有限公司(按字母順序排列)。
其他福利
- Excel 格式的市場預測 (ME) 表
- 3 個月的分析師支持
目錄
第 1 章執行摘要和主要發現
第2章 報告要約
第 3 章 簡介
- 研究假設和市場定義
- 研究範圍
- 調查方法
第4章 產業主要趨勢
- 每公頃作物保護化學品消費量
- 有效成分價格分析
- 法律規範
- 澳洲
- 中國
- 印度
- 印尼
- 日本
- 緬甸
- 巴基斯坦
- 菲律賓
- 泰國
- 越南
- 價值鏈與通路分析
第5章 市場區隔
- 功能
- 殺菌劑
- 除草劑
- 殺蟲劑
- 滅螺劑
- 殺線蟲劑
- 使用模式
- 化學噴塗
- 葉面噴布
- 燻蒸
- 種子處理
- 土壤處理
- 作物類型
- 經濟作物
- 水果和蔬菜
- 糧食
- 豆類和油籽
- 草坪和觀賞植物
- 國家
- 澳洲
- 中國
- 印度
- 印尼
- 日本
- 緬甸
- 巴基斯坦
- 菲律賓
- 泰國
- 越南
- 其他亞太地區
第6章 競爭格局
- 主要策略趨勢
- 市場佔有率分析
- 業務狀況
- 公司簡介
- ADAMA Agricultural Solutions Ltd
- BASF SE
- Bayer AG
- Corteva Agriscience
- FMC Corporation
- Jiangsu Yangnong Chemical Co. Ltd
- Rainbow Agro
- Sumitomo Chemical Co. Ltd
- Syngenta Group
- UPL Limited
第7章:執行長的關鍵策略問題
第 8 章 附錄
- 世界概況
- 概述
- 五力分析框架
- 全球價值鏈分析
- 市場動態(DRO)
- 資訊來源和進一步閱讀
- 圖片列表
- 關鍵見解
- 資料包
- 詞彙表
簡介目錄
Product Code: 52421
The Asia Pacific Crop Protection Chemicals Market size is estimated at 25.31 billion USD in 2025, and is expected to reach 31.2 billion USD by 2030, growing at a CAGR of 4.27% during the forecast period (2025-2030).
Dominance of insecticides and herbicides in the Asia-Pacific market due to a rise in pest and weed attacks
- Agriculture in Asia-Pacific is diverse and plays a significant role in the economies of many countries. The region has a wide range of climates, from tropical to temperate, and is known for the cultivation of rice, soybeans, wheat, and various fruits and vegetables. In 2022, Asia-Pacific occupied a share of 24.7% by value of the global crop protection chemicals market.
- The use of pesticides in order to achieve better yields is encouraged by the increasing demand for food crops due to population growth in the region. At the same time, technological advancements have changed the way farming is done, and new technologies in pest control are benefiting crops and farmers a great deal.
- Insecticides occupied the highest share of 50.8% in the Asia-Pacific crop protection chemicals market. Rice is the major crop cultivated across many regional countries. However, it is also susceptible to various pests, which have led to severe damage to the crop and, subsequently, its yield.
- Herbicides occupied the second-largest share of 28.5% by value in 2022. Weed attacks in staple, commercial, and horticultural crops pose a significant challenge to the region's agricultural productivity. As there is a significant contribution by the fruit industry to the region's economic growth, fruit weeds cause substantial economic damage. Amaranthus retroflexus (Redroot pigweed) and Echinochloa crus-galli (Barnyard grass) are the most common weeds in the regional fruit industry.
- Increased concerns for food security and various market developments have facilitated the efficient and sustainable production of food by farmers while minimizing the impact of pests on their crops. This has driven the market, which is anticipated to register a CAGR of 4.5% during the forecast period (2023-2029).
The market is growing due to the rising consumption of pesticides to protect crops from pests, diseases, and weeds
- In 2022, Asia-Pacific held a market share of 24.7% by value of the global insecticide market. The pesticide segment in the region is of great importance and is constantly evolving. It plays a vital role in promoting productive and sustainable agricultural practices in multiple countries. During the historical period, the pesticide market in Asia-Pacific experienced consistent growth, with a CAGR of 5.5%.
- Asia-Pacific countries like China and India, along with other countries, experience increased pesticide usage due to their varied agricultural landscape, making some crops more vulnerable to pests and diseases. The prevalence of intensive cropping practices and monocultures also contributes to the favorable conditions for pests to thrive. With substantial populations to sustain, ensuring food security becomes a top priority, leading to a heightened need to protect crop yields and minimize losses caused by pests, thus resulting in a greater reliance on pesticides.
- The market is also experiencing growth due to the expansion of agriculture, with the adoption of modern practices and the expansion of cultivated land. The region's agricultural land area grew from 624.5 million ha in 2019 to 662.2 million ha in 2022. As agricultural activities expand, the demand for efficient solutions to protect crops from pests is also growing.
- During the forecast period (2023-2029), Thailand is projected to exhibit the fastest growth rate in the region, with a CAGR of 6.8% by value. This rapid growth can be attributed to the anticipated increase in the usage of pesticides by farmers in the country due to the rising threat of pests and increasing crop losses.
Asia Pacific Crop Protection Chemicals Market Trends
Increasing pest proliferation is leading to higher application of pesticides
- The average consumption of crop protection chemicals in Asia-Pacific was 2.9 kg per hectare of agricultural land in 2022. Fungicides were the highest used among all chemical pesticides, with average consumption amounting to 10.6 kg per hectare. This indicates the significant threat posed on agricultural production by fungal pathogens, resulting in a higher need for fungicides. Fungus-causing rice blast in paddy has developed resistance to MBI-D fungicides, leading to a higher need for fungicidal applications.
- Fungicides are followed by herbicides, with a per hectare application rate of 10.4 kg per hectare in 2022. The increase in herbicide usage per hectare can be attributed to various factors, including an aging farming population, labor shortages, and the expansion of agricultural land. These factors have prompted a transition from manual weeding practices to the utilization of herbicides for effective weed management in significant crops like rice and soybeans. Weeds are also becoming very tough to manage as they are developing resistance to existing herbicides, leading to higher dosages of application.
- Insecticides are the third most applied among pesticides in Asia-Pacific countries, with a per hectare application rate of 8 kg in the year 2022. Global warming and climate change are posing various challenges to agricultural production, even by increasing the pest population through various mechanisms. For instance, the brown planthopper (Nilaparvata lugens), a major pest of rice, has been observed to increase in population and expand its distribution in response to rising temperatures in parts of Asia. Similarly, the usage of nematicides and molluscicides has been increasing amid growing awareness among farmers of their benefits, along with the increasing need.
Limited availability and demand for cypermethrin have increased the price of active ingredients in the Asia-Pacific market
- Cypermethrin is the dominant insecticide used in the region, being a synthetic pyrethroid effective against a wide range of insect pests such as Lepidoptera, Coleoptera, Diptera, and Hemiptera. Countries like India, China, and Vietnam primarily rely on cypermethrin for pest control in various crops. Notably, China and Vietnam are the major importers of cypermethrin. As of 2022, the price of the active ingredient had risen to USD 21,037.7 per metric ton, reflecting a notable increase of 21.1% since 2017. This surge in price can be attributed to the growing demand for cypermethrin in crops like sugarcane, cotton, fruits, and vegetables.
- Atrazine holds a prominent position as a widely utilized herbicide in the region, classified as a chlorinated herbicide of the triazine class. It serves as both a pre- and post-emergence herbicide, effectively controlling annual broadleaf weeds and grasses in crops like soybeans, maize, sugarcane, and turf grasses. The active ingredient's price has experienced consistent year-on-year growth due to its extensive application across various crops. As of the latest recording in 2022, the price stood at USD 13,817.2 per metric ton, marking a significant increase of 29.8% since 2017.
- Mancozeb is a contact fungicide known for its versatile application modes, effectively targeting a wide array of fungal diseases in cereal crops, fruits, vegetables, and pulses. The price of the active ingredient currently stands at USD 7,776.9 per metric ton, making it one of the principal fungicide active ingredients extensively utilized in the Asia-Pacific countries.
- The prices of active ingredients are experiencing annual increases due to the rise in raw material costs, import tariffs, and escalating logistics expenses.
Asia Pacific Crop Protection Chemicals Industry Overview
The Asia Pacific Crop Protection Chemicals Market is fragmented, with the top five companies occupying 33.97%. The major players in this market are BASF SE, Bayer AG, FMC Corporation, Syngenta Group and UPL Limited (sorted alphabetically).
Additional Benefits:
- The market estimate (ME) sheet in Excel format
- 3 months of analyst support
TABLE OF CONTENTS
1 EXECUTIVE SUMMARY & KEY FINDINGS
2 REPORT OFFERS
3 INTRODUCTION
- 3.1 Study Assumptions & Market Definition
- 3.2 Scope of the Study
- 3.3 Research Methodology
4 KEY INDUSTRY TRENDS
- 4.1 Consumption Of Pesticide Per Hectare
- 4.2 Pricing Analysis For Active Ingredients
- 4.3 Regulatory Framework
- 4.3.1 Australia
- 4.3.2 China
- 4.3.3 India
- 4.3.4 Indonesia
- 4.3.5 Japan
- 4.3.6 Myanmar
- 4.3.7 Pakistan
- 4.3.8 Philippines
- 4.3.9 Thailand
- 4.3.10 Vietnam
- 4.4 Value Chain & Distribution Channel Analysis
5 MARKET SEGMENTATION (includes market size in Value in USD and Volume, Forecasts up to 2030 and analysis of growth prospects)
- 5.1 Function
- 5.1.1 Fungicide
- 5.1.2 Herbicide
- 5.1.3 Insecticide
- 5.1.4 Molluscicide
- 5.1.5 Nematicide
- 5.2 Application Mode
- 5.2.1 Chemigation
- 5.2.2 Foliar
- 5.2.3 Fumigation
- 5.2.4 Seed Treatment
- 5.2.5 Soil Treatment
- 5.3 Crop Type
- 5.3.1 Commercial Crops
- 5.3.2 Fruits & Vegetables
- 5.3.3 Grains & Cereals
- 5.3.4 Pulses & Oilseeds
- 5.3.5 Turf & Ornamental
- 5.4 Country
- 5.4.1 Australia
- 5.4.2 China
- 5.4.3 India
- 5.4.4 Indonesia
- 5.4.5 Japan
- 5.4.6 Myanmar
- 5.4.7 Pakistan
- 5.4.8 Philippines
- 5.4.9 Thailand
- 5.4.10 Vietnam
- 5.4.11 Rest of Asia-Pacific
6 COMPETITIVE LANDSCAPE
- 6.1 Key Strategic Moves
- 6.2 Market Share Analysis
- 6.3 Company Landscape
- 6.4 Company Profiles (includes Global level Overview, Market level overview, Core Business Segments, Financials, Headcount, Key Information, Market Rank, Market Share, Products and Services, and analysis of Recent Developments)
- 6.4.1 ADAMA Agricultural Solutions Ltd
- 6.4.2 BASF SE
- 6.4.3 Bayer AG
- 6.4.4 Corteva Agriscience
- 6.4.5 FMC Corporation
- 6.4.6 Jiangsu Yangnong Chemical Co. Ltd
- 6.4.7 Rainbow Agro
- 6.4.8 Sumitomo Chemical Co. Ltd
- 6.4.9 Syngenta Group
- 6.4.10 UPL Limited
7 KEY STRATEGIC QUESTIONS FOR CROP PROTECTION CHEMICALS CEOS
8 APPENDIX
- 8.1 Global Overview
- 8.1.1 Overview
- 8.1.2 Porter's Five Forces Framework
- 8.1.3 Global Value Chain Analysis
- 8.1.4 Market Dynamics (DROs)
- 8.2 Sources & References
- 8.3 List of Tables & Figures
- 8.4 Primary Insights
- 8.5 Data Pack
- 8.6 Glossary of Terms
02-2729-4219
+886-2-2729-4219
 農作物保護化學品市場 - 全球產業規模、佔有率、趨勢、機會和預測,按類型、來源、應用方式、地區和競爭細分,2020-2030 年預測
 中國作物保護化學品市場:市場佔有率分析、產業趨勢與統計、成長預測(2025-2030 年)作物保護化學品-市場佔有率分析、產業趨勢與統計、成長預測(2025-2030 年)北美作物保護化學品-市場佔有率分析、產業趨勢與統計、成長預測(2025-2030)南美作物保護化學品:市場佔有率分析、行業趨勢和統計、成長預測(2025-2030 年)印度作物保護化學品-市場佔有率分析、產業趨勢與統計、2025-2030年成長預測德國作物保護化學品-市場佔有率分析、產業趨勢與統計、成長預測(2025-2030)法國作物保護化學品市場:市場佔有率分析、行業趨勢和成長預測(2025-2030 年)美國作物保護化學品-市場佔有率分析、產業趨勢與統計、成長預測(2025-2030)越南作物保護化學品市場 -市場佔有率分析、行業趨勢和統計、成長預測(2025-2030 年)
▼