


 |
市場調查報告書
商品編碼
1683542
日本電動自行車:市場佔有率分析、行業趨勢和統計、成長預測(2025-2029 年)Japan E-bike - Market Share Analysis, Industry Trends & Statistics, Growth Forecasts (2025 - 2029) |
||||||
價格
※ 本網頁內容可能與最新版本有所差異。詳細情況請與我們聯繫。
簡介目錄
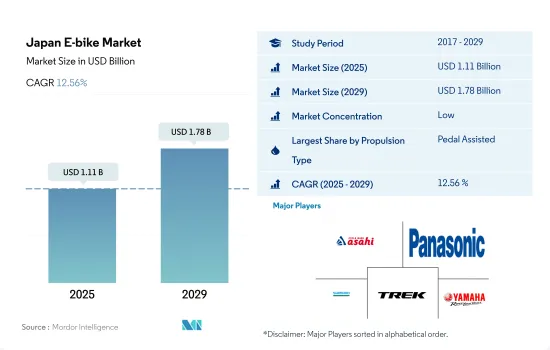
日本電動自行車市場規模預計在 2025 年為 11.1 億美元,預計到 2029 年將達到 17.8 億美元,預測期內(2025-2029 年)的複合年成長率為 12.56%。
推進系統細分市場概覽
- 日本是對電動自行車較為熟悉的亞洲國家。電動式自行車被引入日本市場,並為老年人提供了幫助,因為騎自行車在日常活動中不需要太多的體力。像 Pedelec 這樣的電動式自行車的基本優勢在於它們易於用於跑腿和通勤等日常活動。日本的電動自行車擁有者大部分都購買了助力電動式自行車,因為他們居住在多山丘的住宅區。
- 由於地形崎嶇,日本的公路網綿延128萬公里,由數百座橋樑和隧道組成。遠距騎行在日本各地非常普遍,因為該國擁有大量高速公路,且交通流量不大。 2021年,電動式自行車(pedelecs)的價格預計通常在7萬至15萬日圓之間,此類自行車約佔日本新自行車銷量的12.2%。
- 在日本,使用輕便摩托車舉辦的活動數量從 2011 年的約 23,140 場下降到 2020 年的不到 7,000 場。道路上的自行車越多,發生事故的可能性就越小。年輕人對上坡騎行等運動的興趣日益濃厚,以及對健康積極生活方式的認知不斷增強,預計將在未來幾年推動市場需求。助力自行車對於短距離騎乘來說很方便,但在不久的將來,高速電動自行車可能會成為最方便的選擇。此外,隨著功率和速度能力的提升,未來幾年消費者可能傾向於選擇高速電動自行車。
日本電動自行車市場趨勢
日本電動自行車的普及率一直穩定提高,反映出市場滲透率和消費者接受度的不斷提高。
- 日本電動自行車市場正迅速成為都市區最受歡迎的交通途徑。電動自行車比汽車更靈活、更快,因為它們更易於操縱並且可以輕鬆避開減慢車輛速度的障礙物。
- 近年來,日本的電動自行車銷售一直在增加,老年人和有小孩的雙收入父母的需求不斷成長。當電動式自行車首次引進日本市場時,主要目標族群是老年人。電動式自行車,例如腳踏自行車,方便通勤。對老年人來說,其好處是他們用較少的體力就能進行日常生活。然而,近年來,越來越多的學齡前兒童家長使用便捷的電動自行車送孩子到托兒所。
- 商業活動的恢復和封鎖期間實施的貿易限制的解除,導致日本電動自行車的採用率增加。貿易限制的取消有利於日本的進出口活動。由於電動自行車具有燃油經濟性好、節省時間等特點和優勢,預計日本電動自行車的普及率仍將持續提高。
在日本,很大一部分通勤者每天的通勤距離在 5 至 15 公里之間,這表明他們強烈偏好這個距離。
- 自行車文化在該國越來越受歡迎。近年來,日本對自行車的需求不斷增加。越來越多的人使用自行車往返於學校、市場和工作場所等各個地方。到2020年,將會有更多的人使用自行車來鍛鍊身體以及前往5至15公里範圍內的市場、辦公室等附近場所。因此,與 2019 年相比,2020 年日本對自行車的需求增加。
- 疫情期間實施的限制和障礙對日本自行車市場產生了巨大的正面影響。越來越多的日本人短距離出行選擇步行或騎自行車代替使用其他汽車。此外,性能更強大、電池壽命更長的電動自行車的出現也鼓勵人們選擇騎自行車進行週末活動和鍛煉,與 2020 年相比,2021 年日本騎行 5-15 公里通勤者的數量進一步增加。
- 隨著人們騎自行車前往附近地點的習慣逐漸養成,使用自行車進行短距離出行變得很普遍。目前,許多人每天騎自行車到當地的市場或職場,距離為5至15公里。由於騎自行車更有利於健康、排放碳通勤並且可以避免交通堵塞而節省時間,越來越多的人喜歡騎自行車上班。由於這些因素,預計預測期內日本 5 至 15 公里通勤人數將會增加。
日本電動自行車產業概況
日本電動自行車市場較為分散,前五大企業佔了37.20%的市場。市場的主要企業是:Asahi Cycle、Panasonic Cycle Technology、Shimano Inc.、Trek Bicycle Corporation 和 Yamaha Bicycles(按字母順序排列)。
其他福利
- Excel 格式的市場預測 (ME) 表
- 3 個月的分析師支持
目錄
第 1 章執行摘要和主要發現
第2章 報告要約
第 3 章 簡介
- 研究假設和市場定義
- 研究範圍
- 調查方法
第4章 產業主要趨勢
- 自行車銷量
- 人均國內生產毛額
- 通貨膨脹率
- 電動自行車普及率
- 每天出遊 5 至 15 公里的人口/通勤者百分比
- 自行車出租
- 電動自行車電池價格
- 電池化學價格表
- 超本地化配送
- 自行車道
- 徒步人數
- 電池充電容量
- 交通堵塞指數
- 法律規範
- 價值鏈與通路分析
第5章 市場區隔
- 推進類型
- 踏板輔助
- 高速電動自行車
- 油門輔助
- 應用程式類型
- 貨運/公用設施
- 城市/城區
- 健行
- 電池類型
- 鉛酸電池
- 鋰離子電池
- 其他
第6章 競爭格局
- 主要策略趨勢
- 市場佔有率分析
- 業務狀況
- 公司簡介
- Asahi Cycle Co. Ltd
- Bridgestone Cycle Co. Ltd
- Fujikom Co. Ltd
- Giant Manufacturing Co. Ltd.
- Kawasaki Motors Corporation Japan
- Maxon Motor AG
- Panasonic Cycle Technology Co. Ltd
- Shimano Inc.
- Trek Bicycle Corporation
- Yamaha Bicycles
第7章:執行長的關鍵策略問題
第 8 章 附錄
- 世界概況
- 概述
- 五力分析框架
- 全球價值鏈分析
- 市場動態(DRO)
- 資訊來源和進一步閱讀
- 圖片列表
- 關鍵見解
- 資料包
- 詞彙表
簡介目錄
Product Code: 92156
The Japan E-bike Market size is estimated at 1.11 billion USD in 2025, and is expected to reach 1.78 billion USD by 2029, growing at a CAGR of 12.56% during the forecast period (2025-2029).
PROPULSION SEGMENT MARKET OVERVIEW
- Japan is an Asian country that is no stranger to electric bikes. Electric power-assisted bicycles were introduced to the Japanese market, aiding the elderly by requiring less physical strength to navigate their daily life on a bicycle. The fundamental advantage of motorized bicycles, such as pedelecs, is the ease with which they may be used in daily life, such as doing errands or commuting. The majority of pedelec owners in Japan purchased their pedal-assist electric bicycles because they live in a residential area with a high number of slopes.
- Due to the island's rough geography, Japan's road system comprises more than 1.28 million kilometres of length and hundreds of bridges and tunnels. Because there are so many highways in Japan with little traffic, long-distance cycling is extremely common throughout much of the country. In 2021, pedal electric cycles (pedelecs), which make up around 12.2 percent of all new bicycle sales in Japan, will typically cost between 70 and 150 thousand Japanese yen.
- In Japan, the number of events using motorised bicycles has decreased from approximately 23.14 thousand in 2011 to fewer than 7,000 in 2020. The increased number of bicycles on the road reduces the likelihood of an accident. Rising youth interest in sports such as uphill cycling, as well as increased awareness of a healthy and active lifestyle, are expected to fuel market demand in the future years. The pedal-assist bicycle is useful for short distances, but the speed Pedelec will be the most convenient option in the near future. Furthermore, as power and speed capabilities improve, consumers will most likely gravitate toward the Speed Pedelec category in the coming years.
Japan E-bike Market Trends
Japan exhibits a consistent increase in E-Bike adoption rates, reflecting growing market penetration and consumer acceptance.
- The e-bike market in Japan is quickly becoming the most popular mode of transportation in urban areas. E-bikes are more agile and quicker than cars as they are extremely maneuverable and can readily dodge obstacles that cause a vehicle to slow down.
- In recent years, the number of e-bikes sold in Japan has increased, showing significant demand from a growing number of older people and working parents with young children. Older people were the major target demographic when electric power-assist bicycles were first introduced to the Japanese market. Motorized bicycles, such as pedelecs, are more convenient to commute. The elderly benefit from these bicycles as they allow them to exert less physical strength to navigate their everyday lives. However, in recent years, parents of preschool children have grown to rely on the convenience of e-bikes while dropping their children at daycare centers.
- Due to the resumption of business activities and the removal of trade restrictions imposed during lockdown, the adoption of e-bikes increased in Japan. Lifting trade regulations has benefited the country's import and export activities. Due to e-bikes features and benefits, such as fuel efficiency and time savings, their adoption rate is projected to increase in Japan in the future.
Japan maintains a high percentage of commuters traveling 5-15 km daily, indicating a strong preference for this travel distance.
- The bicycle culture is gaining popularity in the country. Over the years, bicycle demand in Japan has increased. The usage of bicycles for commuting to various places, such as schools, marketplaces, and job sites, is increasing in the country. In 2020, more people started using bicycles to travel a distance of 5-15 km for exercising and going to nearby places, such as markets or offices. Therefore, the demand for bicycles in Japan increased in 2020 compared to 2019.
- The restrictions and barriers imposed during the pandemic significantly and favorably affected the bicycle market in Japan. For short trips, more Japanese choose to walk or bike instead of using other automobiles. The availability of e-bikes with more sophisticated features and longer battery lives also encouraged individuals to choose bicycles for weekend activities and exercise, further boosting the number of commuters in Japan who traveled 5-15 km on bicycles in 2021 compared to 2020.
- Bicycle use for short trips became common as people habitually used bicycles to commute to nearby places. Currently, many individuals commute daily by bicycle, covering a distance of 5-15 km to local markets and workplaces. More people prefer to commute by bicycle due to the growing health benefits, carbon-free commuting, and saving time by avoiding traffic. These factors are anticipated to increase the number of people commuting a distance of 5-15 km in Japan during the forecast period.
Japan E-bike Industry Overview
The Japan E-bike Market is fragmented, with the top five companies occupying 37.20%. The major players in this market are Asahi Cycle Co. Ltd, Panasonic Cycle Technology Co. Ltd, Shimano Inc., Trek Bicycle Corporation and Yamaha Bicycles (sorted alphabetically).
Additional Benefits:
- The market estimate (ME) sheet in Excel format
- 3 months of analyst support
TABLE OF CONTENTS
1 EXECUTIVE SUMMARY & KEY FINDINGS
2 REPORT OFFERS
3 INTRODUCTION
- 3.1 Study Assumptions & Market Definition
- 3.2 Scope of the Study
- 3.3 Research Methodology
4 KEY INDUSTRY TRENDS
- 4.1 Bicycle Sales
- 4.2 GDP Per Capita
- 4.3 Inflation Rate
- 4.4 Adoption Rate Of E-bikes
- 4.5 Percent Population/commuters With 5-15 Km Daily Travel Distance
- 4.6 Bicycle Rental
- 4.7 E-bike Battery Price
- 4.8 Price Chart Of Different Battery Chemistry
- 4.9 Hyper-local Delivery
- 4.10 Dedicated Bicycle Lanes
- 4.11 Number Of Trekkers
- 4.12 Battery Charging Capacity
- 4.13 Traffic Congestion Index
- 4.14 Regulatory Framework
- 4.15 Value Chain & Distribution Channel Analysis
5 MARKET SEGMENTATION (includes market size in Value in USD and Volume, Forecasts up to 2029 and analysis of growth prospects)
- 5.1 Propulsion Type
- 5.1.1 Pedal Assisted
- 5.1.2 Speed Pedelec
- 5.1.3 Throttle Assisted
- 5.2 Application Type
- 5.2.1 Cargo/Utility
- 5.2.2 City/Urban
- 5.2.3 Trekking
- 5.3 Battery Type
- 5.3.1 Lead Acid Battery
- 5.3.2 Lithium-ion Battery
- 5.3.3 Others
6 COMPETITIVE LANDSCAPE
- 6.1 Key Strategic Moves
- 6.2 Market Share Analysis
- 6.3 Company Landscape
- 6.4 Company Profiles
- 6.4.1 Asahi Cycle Co. Ltd
- 6.4.2 Bridgestone Cycle Co. Ltd
- 6.4.3 Fujikom Co. Ltd
- 6.4.4 Giant Manufacturing Co. Ltd.
- 6.4.5 Kawasaki Motors Corporation Japan
- 6.4.6 Maxon Motor AG
- 6.4.7 Panasonic Cycle Technology Co. Ltd
- 6.4.8 Shimano Inc.
- 6.4.9 Trek Bicycle Corporation
- 6.4.10 Yamaha Bicycles
7 KEY STRATEGIC QUESTIONS FOR E BIKES CEOS
8 APPENDIX
- 8.1 Global Overview
- 8.1.1 Overview
- 8.1.2 Porter's Five Forces Framework
- 8.1.3 Global Value Chain Analysis
- 8.1.4 Market Dynamics (DROs)
- 8.2 Sources & References
- 8.3 List of Tables & Figures
- 8.4 Primary Insights
- 8.5 Data Pack
- 8.6 Glossary of Terms
02-2729-4219
+886-2-2729-4219
 全球電動自行車訂閱平台市場:產業分析、規模、佔有率、成長、趨勢與預測(2025-2032年)
 Speed Pedelec 電動自行車:市場佔有率分析、產業趨勢與統計、成長預測(2025-2029 年)
 中東電動自行車:市場佔有率分析、產業趨勢與統計、成長預測(2025-2029 年)
 亞太電動自行車:市場佔有率分析、行業趨勢和統計、成長預測(2025-2029 年)
 北美電動自行車:市場佔有率分析、行業趨勢和統計、成長預測(2025-2030 年)
 南美電動自行車:市場佔有率分析、行業趨勢和統計、成長預測(2025-2029 年)
 印度電動自行車:市場佔有率分析、行業趨勢和統計、成長預測(2025-2030 年)
 德國電動自行車:市場佔有率分析、行業趨勢和統計、成長預測(2025-2029 年)
 法國電動自行車:市場佔有率分析、行業趨勢和統計、成長預測(2025-2029 年)
 美國電動自行車:市場佔有率分析、行業趨勢和統計、成長預測(2025-2029 年)
▼