


 |
市場調查報告書
商品編碼
1690853
北美電動自行車:市場佔有率分析、行業趨勢和統計、成長預測(2025-2030 年)North America E-bike - Market Share Analysis, Industry Trends & Statistics, Growth Forecasts (2025 - 2030) |
||||||
價格
※ 本網頁內容可能與最新版本有所差異。詳細情況請與我們聯繫。
簡介目錄
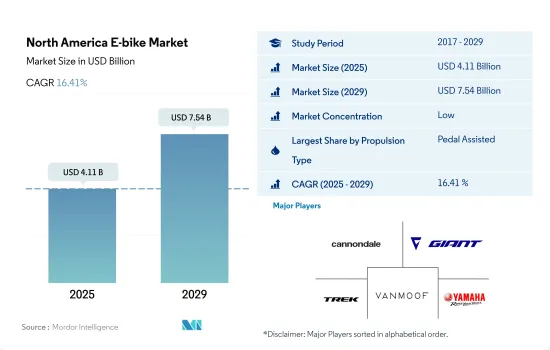
北美電動自行車市場規模預計在 2025 年為 41.1 億美元,預計到 2029 年將達到 75.4 億美元,預測期內(2025-2029 年)的複合年成長率為 16.41%。
推進系統細分市場概覽
- 電動車產業正在穩步改變北美汽車產業,這很大程度上歸功於每年都推出更有效率、更強大的電動車。電動自行車不僅是更清潔、更環保的短程交通選擇,在美國也被廣泛應用於各行各業。騎乘助力電動自行車的長期好處是,您不需要留出特定的時間鍛煉,可以在通勤或上學途中保持健康。大多數員工工作時都坐在辦公桌前。電動自行車可以幫助您鍛鍊身體,同時節省時間。
- 為了解決交通堵塞和污染等主要問題,地方政府正在鼓勵發展電動自行車基礎設施。一些公司正憑藉創新踏板輔助電動自行車進入市場。許多公司正在致力於進一步的產品創新來解決這些問題。
- 交通部門和其他組織正在投資電動自行車租賃和共享通行證,以提高電子交通的普及。電動自行車通常配備 GPS,分析行動資料有助於企業和組織制定策略性擴張規劃。未來基於技術的車輛,例如更強大的高速電動自行車和輔助自行車,有望滿足北美地區對電動自行車的巨大需求和銷售。
北美各國市場
- 北美電動自行車市場是一個高度分散的市場,該地區既有本地參與者,也有國際參與者。該地區的主要城市面臨交通堵塞、道路交通事故死亡和受傷、當地空氣品質、氣候變遷、肥胖和缺乏運動、經濟負擔以及國際石油供應率等交通挑戰。讓人們從汽車轉向其他交通途徑(例如騎自行車)可以幫助應對這些挑戰。
- 隨著通勤者尋找合適的個人交通解決方案,北美對電動自行車的需求正在飆升。購買電動自行車會增加人們上下班的距離,從平均每天 2.1 公里增加到 9.2 公里。電動自行車適合所有年齡層的人。年輕人用它來通勤和鍛煉,而老年人主要用於短途、安全的通勤。
- 地方政府正在鼓勵在公共道路上使用電動自行車以協助電氣化進程。基於上述趨勢,未來最後一哩配送和公共自行車共享網路對電動自行車的需求可能會增加。
北美電動自行車市場趨勢
美國的電動自行車使用率正在穩步成長,反映出人們正在逐漸轉向更綠色的交通方式。
- 北美對電動自行車的需求正在大幅增加。燃料價格上漲、高密度交通狀況和健康問題是推動北美國家擴大採用電動自行車的一些因素。美國是電動自行車銷量最多的國家。與加拿大和墨西哥等其他國家相比,該國 2018 年的採用率很高。 2018 年,電動自行車需求不斷成長,推動北美電動自行車普及率達 2.3%。
- 2020 年,北美對電動自行車的需求發生了迅速變化。該地區是 2020 年電動自行車普及率最高的地區。疫情對自行車(包括電動自行車)的普及產生了積極影響。 2020年,人們選擇更個人化的交通方式,運動習慣養成,對自行車市場產生了正面影響。這些因素導致該地區 2020 年的滲透率為 3.1%。
- 在北美,消費者對電動自行車的興趣正在顯著成長。該地區的各家公司都推出了配備最新技術的新車型,以吸引消費者購買電動自行車。 2022 年 3 月,摩托車製造商Yamaha在美國推出了新款電動自行車:Wabash RT Gravel Adventure Model 和 CrossCore RC Fitness Commuter。兩種型號均由 500 瓦時鋰離子電池供電,額定速度為 28 英里/小時,並具有 3 級踏板輔助功能。預計此類產品的推出將在預測期內推動北美地區電動自行車的普及。
以美國為首,通勤距離在5至15公里之間的人數一直穩定增加,凸顯人們轉向較適中的通勤距離。
- 北美有許多不同的國家非常重視騎自行車,包括美國、加拿大和墨西哥。近年來,這些國家對自行車的需求不斷增加。北美各國的人們逐漸轉向使用自行車前往附近的地方,如辦公室、商業區、購物中心等。在美國,大多數人每天通勤5至15公里。
- 在新冠疫情爆發後,北美各地的健身房和公共運輸都關閉了,全國各地的人們發現騎自行車是一種安全、與社會隔離的交通途徑。疫情期間,人們選擇在週末騎自行車運動或到附近地區休閒旅行。這些因素導致 2020 年出行距離在 5 至 15 公里之間的通勤人數增加了 1% 以上。配備先進電池組、續航里程可達 40-45 公里的電動自行車的推出吸引了每天騎行 5-15 公里的消費者。
- 隨著與新冠肺炎疫情相關的限制措施的放寬,北美各地的辦公室和企業開始營業。現在許多人騎自行車去上班或去其他地方。在美國和墨西哥這樣人口密集的國家,騎自行車上下班越來越受歡迎,因為這樣有利於健康、排放碳旅行、節省燃料和節省時間。預計這些因素將在預測期內加速北美地區的自行車旅行。
北美電動自行車產業概況
北美電動自行車市場較為分散,前五大公司佔了22.72%的市場。市場的主要企業是:Cycling Sports Group, Inc.、Giant Manufacturing Co.、Trek Bicycle Corporation、VanMoof 和 Yamaha Bicycles(按字母順序排列)。
其他福利
- Excel 格式的市場預測 (ME) 表
- 3 個月的分析師支持
目錄
第 1 章執行摘要和主要發現
第2章 報告要約
第 3 章 簡介
- 研究假設和市場定義
- 研究範圍
- 調查方法
第4章 產業主要趨勢
- 自行車銷量
- 人均國內生產毛額
- 通貨膨脹率
- 電動自行車普及率
- 每天出遊 5-15 公里的人口/通勤者百分比
- 自行車出租
- 電動自行車電池價格
- 電池化學價格表
- 超本地化配送
- 自行車道
- 徒步人數
- 電池充電容量
- 交通堵塞指數
- 法律規範
- 價值鏈與通路分析
第5章 市場區隔
- 推進類型
- 踏板輔助
- 高速電動自行車
- 油門輔助
- 應用程式類型
- 貨運/公用設施
- 城市/城區
- 健行
- 電池類型
- 鉛酸電池
- 鋰離子電池
- 其他
- 按國家
- 加拿大
- 墨西哥
- 美國
- 北美其他地區
第6章 競爭格局
- 主要策略趨勢
- 市場佔有率分析
- 業務狀況
- 公司簡介
- Cycling Sports Group, Inc.
- Giant Manufacturing Co.
- Propella Electric Bikes
- Rad Power Bikes
- Ride Aventon Inc.
- Riese & Muller
- Royal Dutch Gazelle
- Trek Bicycle Corporation
- VanMoof
- Yamaha Bicycles
第7章:執行長的關鍵策略問題
第 8 章 附錄
- 世界概況
- 概述
- 五力分析框架
- 全球價值鏈分析
- 市場動態(DRO)
- 資訊來源和進一步閱讀
- 圖片列表
- 關鍵見解
- 資料包
- 詞彙表
簡介目錄
Product Code: 72095
The North America E-bike Market size is estimated at 4.11 billion USD in 2025, and is expected to reach 7.54 billion USD by 2029, growing at a CAGR of 16.41% during the forecast period (2025-2029).
PROPULSION SEGMENT MARKET OVERVIEW
- The electric vehicle industry is steadily revolutionizing the automobile sector in North America, mostly with the yearly introduction of increasingly efficient and powerful electric vehicles. Apart from being a cleaner and greener mode of transportation for short distances, e-bikes are being used across a wide range of industries and applications in the United States. The long-term benefits of riding a pedal-assisted e-bike involve working out while traveling to and from work instead of having to set aside a specific time for exercising. Most employees spend their workdays sitting at their desks. E-bikes help in exercising while saving time.
- In order to address major issues like traffic congestion and pollution, regional governments are boosting the construction of e-bike infrastructure. Several businesses are entering the market with innovative pedal-assisted e-bikes. Many companies are working on more product innovations to cater to these issues.
- Transportation agencies and other organizations are investing in e-bike rentals and sharing passes to increase the popularity of electronic modes of travel. E-bikes are typically fitted with GPS, thereby helping operators and organizations plan systematic expansions by analyzing mobility data. Future technology-based vehicles, like speed pedelecs and pedal-assisted bikes with higher functionalities, are expected to meet the enormous demand for and the sales of e-bikes in the North American region.
NORTH AMERICA COUNTRY LEVEL MARKET OVERVIEW
- The North American market for e-bikes is an extremely fragmented one, with the presence of both local and international players in the region. Major cities in the region face transportation challenges related to traffic congestion, injury and loss of life due to road crashes, local air quality, climate change, obesity and physical inactivity, economic burden, and the international supply rate of oil. Shifting people from cars to other modes of transportation, such as bicycles, can help address these challenges.
- The demand for e-bikes in North America is soaring as commuters are looking for suitable means of personal transportation. Purchasing an e-bike leads to increased commute, rising from 2.1 km to 9.2 km per day on average. E-bikes can be used by people of different age groups. Younger people use them for commutes and exercise, and older people mainly use them for shorter and safer commutes.
- Local governments are encouraging the use of e-bikes on public roadways to help in the process of electrification. According to the aforementioned trends, the demand for e-bikes for last-mile deliveries and public bicycle-sharing networks is likely to rise in the future.
North America E-bike Market Trends
The US leads with a robust increase in e-bike adoption, reflecting a significant shift towards eco-friendly transportation.
- The North American region is witnessing a significant demand for e-bicycles. Rising fuel prices, highly dense traffic conditions, and health concerns are some of the factors responsible for the increasing adoption of e-bikes across North American countries. The United States accounts for the highest sales of e-bikes. The country witnessed a higher adoption rate in 2018 compared to other countries like Canada and Mexico. The rising demand for e-bikes accelerated their adoption rate by 2.3% across North America in 2018.
- North America witnessed a rapid change in the demand for e-bikes in 2020. The region accounted for the highest adoption rate of e-bikes in 2020. The pandemic had a positive impact on the adoption rate of bicycles, including e-bikes. In 2020, people opted for more personal rides and developed exercising habits, which had a positive impact on the bicycle market. Owing to these factors, the region witnessed an adoption rate of 3.1% in 2020.
- The interest of consumers in e-bicycles is growing tremendously across North America. The launch of new models with updated technologies by various companies across the region is attracting consumers toward e-bikes. In March 2022, the two-wheeler manufacturer, Yamaha, introduced new e-bikes, Wabash RT Gravel Adventure Model and CrossCore RC Fitness Commuter, in the United States. Both the models are equipped with 500-watt-hour lithium-ion batteries with speed support of 28 mph, and they have class-3 pedal-assist features. Such new launches are expected to enhance the adoption of e-bikes in North America during the forecast period.
A consistent upward trajectory in the population commuting 5-15 km, led by the US, highlights a shift towards moderate commuting distances.
- North America comprises various bicycle-oriented countries like the United States, Canada, and Mexico. The demand for bicycles in these countries has increased over the recent years. People in various countries across North America are gradually shifting to using bicycles to go to nearby places like offices, business areas, and malls. The United States has the highest number of daily commuters who travel between 5 km and 15 km.
- After the COVID-19 outbreak, which led to the closure of gyms and public transit across North America, various people found bicycles to be a safe and socially isolated mode of transportation. During the pandemic, people chose to exercise through cycling or going for weekend recreational runs to nearby locations. These factors increased the number of commuters who traveled between 5 kilometers and 15 kilometers by more than 1% in 2020. The launch of e-bikes with advanced battery packs for providing an enhanced range of up to 40-45 kilometers attracted consumers who travel a distance of 5-15 kilometers daily.
- Relaxation of the COVID-19-related restrictions opened up offices and businesses across North America. Many people now commute by bicycle to their places of employment and other areas. The popularity of bicycle-based commuting is increasing due to health benefits, carbon-free journeys, fuel savings, and time savings in packed countries like the United States and Mexico. Such factors are expected to accelerate bicycle journeys across North America during the forecast period.
North America E-bike Industry Overview
The North America E-bike Market is fragmented, with the top five companies occupying 22.72%. The major players in this market are Cycling Sports Group, Inc., Giant Manufacturing Co., Trek Bicycle Corporation, VanMoof and Yamaha Bicycles (sorted alphabetically).
Additional Benefits:
- The market estimate (ME) sheet in Excel format
- 3 months of analyst support
TABLE OF CONTENTS
1 EXECUTIVE SUMMARY & KEY FINDINGS
2 REPORT OFFERS
3 INTRODUCTION
- 3.1 Study Assumptions & Market Definition
- 3.2 Scope of the Study
- 3.3 Research Methodology
4 KEY INDUSTRY TRENDS
- 4.1 Bicycle Sales
- 4.2 GDP Per Capita
- 4.3 Inflation Rate
- 4.4 Adoption Rate Of E-bikes
- 4.5 Percent Population/commuters With 5-15 Km Daily Travel Distance
- 4.6 Bicycle Rental
- 4.7 E-bike Battery Price
- 4.8 Price Chart Of Different Battery Chemistry
- 4.9 Hyper-local Delivery
- 4.10 Dedicated Bicycle Lanes
- 4.11 Number Of Trekkers
- 4.12 Battery Charging Capacity
- 4.13 Traffic Congestion Index
- 4.14 Regulatory Framework
- 4.15 Value Chain & Distribution Channel Analysis
5 MARKET SEGMENTATION (includes market size in Value in USD and Volume, Forecasts up to 2029 and analysis of growth prospects)
- 5.1 Propulsion Type
- 5.1.1 Pedal Assisted
- 5.1.2 Speed Pedelec
- 5.1.3 Throttle Assisted
- 5.2 Application Type
- 5.2.1 Cargo/Utility
- 5.2.2 City/Urban
- 5.2.3 Trekking
- 5.3 Battery Type
- 5.3.1 Lead Acid Battery
- 5.3.2 Lithium-ion Battery
- 5.3.3 Others
- 5.4 Country
- 5.4.1 Canada
- 5.4.2 Mexico
- 5.4.3 US
- 5.4.4 Rest-of-North America
6 COMPETITIVE LANDSCAPE
- 6.1 Key Strategic Moves
- 6.2 Market Share Analysis
- 6.3 Company Landscape
- 6.4 Company Profiles
- 6.4.1 Cycling Sports Group, Inc.
- 6.4.2 Giant Manufacturing Co.
- 6.4.3 Propella Electric Bikes
- 6.4.4 Rad Power Bikes
- 6.4.5 Ride Aventon Inc.
- 6.4.6 Riese & Muller
- 6.4.7 Royal Dutch Gazelle
- 6.4.8 Trek Bicycle Corporation
- 6.4.9 VanMoof
- 6.4.10 Yamaha Bicycles
7 KEY STRATEGIC QUESTIONS FOR E BIKES CEOS
8 APPENDIX
- 8.1 Global Overview
- 8.1.1 Overview
- 8.1.2 Porter's Five Forces Framework
- 8.1.3 Global Value Chain Analysis
- 8.1.4 Market Dynamics (DROs)
- 8.2 Sources & References
- 8.3 List of Tables & Figures
- 8.4 Primary Insights
- 8.5 Data Pack
- 8.6 Glossary of Terms
02-2729-4219
+886-2-2729-4219
 Speed Pedelec 電動自行車:市場佔有率分析、產業趨勢與統計、成長預測(2025-2029 年)
 中東電動自行車:市場佔有率分析、產業趨勢與統計、成長預測(2025-2029 年)
 亞太電動自行車:市場佔有率分析、行業趨勢和統計、成長預測(2025-2029 年)
 南美電動自行車:市場佔有率分析、行業趨勢和統計、成長預測(2025-2029 年)
 印度電動自行車:市場佔有率分析、行業趨勢和統計、成長預測(2025-2030 年)
 德國電動自行車:市場佔有率分析、行業趨勢和統計、成長預測(2025-2029 年)
 日本電動自行車:市場佔有率分析、行業趨勢和統計、成長預測(2025-2029 年)
 法國電動自行車:市場佔有率分析、行業趨勢和統計、成長預測(2025-2029 年)
 美國電動自行車:市場佔有率分析、行業趨勢和統計、成長預測(2025-2029 年)
 義大利電動自行車:市場佔有率分析、行業趨勢和統計、成長預測(2025-2029 年)
▼