


 |
市場調查報告書
商品編碼
1683780
美國電動自行車:市場佔有率分析、行業趨勢和統計、成長預測(2025-2029 年)United States E-bike - Market Share Analysis, Industry Trends & Statistics, Growth Forecasts (2025 - 2029) |
||||||
※ 本網頁內容可能與最新版本有所差異。詳細情況請與我們聯繫。
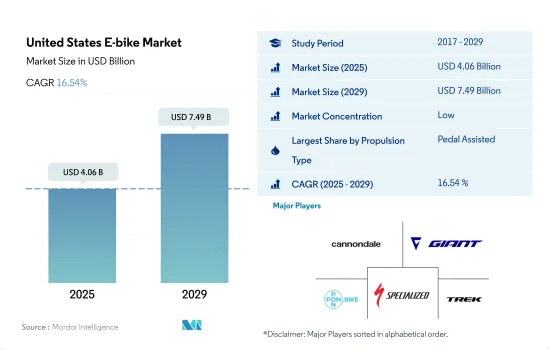
美國電動自行車市場規模預計在 2025 年為 40.6 億美元,預計到 2029 年將達到 74.9 億美元,預測期內(2025-2029 年)的複合年成長率為 16.54%。
推進系統細分市場概覽
- 隨著每年推出更有效率、更強大的電動車,電動車產業正穩步改變汽車格局。助力電動自行車和高速電動自行車在美國的各行各業中廣泛應用。作為一種更清潔、更環保的交通途徑,它正受到人們的關注。美國電動自行車進口量和銷量的激增,促使多家電動自行車製造商籌集資金以擴大公司規模。根據輕型電動車協會統計,2021年該國進口了790萬輛電動自行車,是2020年的1.8倍。
- 由於新冠疫情的影響,助力電動自行車在全國各地流行起來。消費者越來越關注自己的健康和福祉。到 2021 年,預計美國 60% 的旅行距離將少於 5 英里,電動自行車可以輕鬆滿足這一需求。 COVID-19 疫情以多種方式影響了市場,最初由於製造業的封鎖和停工而抑制了需求。但隨著法規的放寬,對電動自行車的需求獲得了顯著的成長,美國經銷商報告稱,電動自行車的銷量比上與前一年同期比較成長了 100% 以上。
- 政府對共享單車計畫、自行車道和行人友善道路的投入增加,可能激發消費者對高速電動自行車和油門輔助電動自行車的興趣。預測期內,對電動自行車城市道路基礎設施的投資也有望推動電動自行車市場的發展。目前的投資、資金籌措和舉措正在幫助促進美國各地的電動自行車銷售。
美國電動自行車市場的趨勢
美國電動自行車的普及率一直呈現高成長,顯示其日益普及且市場不斷成長。
- 近年來,自行車逐漸成為美國流行的日常通勤選擇。電動自行車的推出也導致近年來自行車需求量的激增。污染加劇、交通狀況惡化以及燃料價格上漲正推動電動自行車在美國各地的流行。電動自行車在各個年齡層中越來越受歡迎。 50歲以上的人也對電動自行車表現出濃厚的興趣。因此,2019年電動自行車的普及率較2018年提升了2.4%。
- 2020 年新冠疫情對美國電動自行車市場產生了正面影響。社交距離措施、人們對使用公共的擔憂等因素導致消費者出行偏好發生變化,進一步推動2020年的電動自行車普及率較2019年成長2.7%。
- 電動自行車公司正在推出配備先進技術的新型車型,以吸引客戶並提高在美國的銷售量。此外,消費者偏好更清潔、更健康的交通方式,同時節省燃料成本,也促使電動自行車的普及率不斷提高。受這些因素影響,預計2021年該國電動自行車普及率將比2020年增加3%,預測期內預計將成長12.24%。
在美國,每天出遊5至15公里的人數比例穩定增加,呈現一致的通勤模式。
- 近年來,美國對自行車的需求大幅增加。儘管對自行車的需求正在增加,但與其他交通途徑相比,5至15公里通勤距離的自行車使用率仍然較低。 2019年,美國只有0.6%的工人選擇騎自行車作為交通途徑。
- 2020 年,在新冠疫情爆發後,數百萬美國人重新發現騎自行車是一種安全且社會邊緣的交通途徑。配備先進電池組的電動自行車續航里程可達 40-45 公里,也推動了每日出行距離為 5-15 公里的消費者的需求。由於疫情期間健身房和健身俱樂部關閉,騎自行車也成為人們首選的運動方式。
- 然而,即使在疫情結束後,許多人仍然騎自行車到5-15公里範圍內的職場、辦公室、企業和市場。到2022年,超過15%的人將使用自行車作為交通工具。騎自行車有益健康,是一種碳排放的交通方式,不耗費燃料,還能節省交通擁擠的時間。這些優勢極大地促進了自行車的普及,並可能在預測期內進一步促進該國的市場發展。
美國電動自行車產業概況
美國電動自行車市場較為分散,前五大公司的市佔率為30.99%。該市場的主要企業是:Cycling Sports Group, Inc.、Giant Manufacturing Co.、Pon Holdings BV、Specialized Bicycle Components Inc. 和 Trek Bicycle Corporation(按字母順序排列)。
其他福利
- Excel 格式的市場預測 (ME) 表
- 3 個月的分析師支持
目錄
第 1 章執行摘要和主要發現
第2章 報告要約
第 3 章 簡介
- 研究假設和市場定義
- 研究範圍
- 調查方法
第4章 產業主要趨勢
- 自行車銷量
- 人均國內生產毛額
- 通貨膨脹率
- 電動自行車普及率
- 每天出遊 5-15 公里的人口/通勤者百分比
- 自行車出租
- 電動自行車電池價格
- 電池化學價格表
- 超本地化配送
- 自行車道
- 徒步人數
- 電池充電容量
- 交通堵塞指數
- 法律規範
- 價值鏈與通路分析
第5章 市場區隔
- 推進類型
- 踏板輔助
- 高速電動自行車
- 油門輔助
- 應用程式類型
- 貨運/公用設施
- 城市/城區
- 健行
- 電池類型
- 鉛酸電池
- 鋰離子電池
- 其他
第6章 競爭格局
- 主要策略趨勢
- 市場佔有率分析
- 業務狀況
- 公司簡介
- Ariel Rider
- Cycling Sports Group, Inc.
- Giant Manufacturing Co.
- Pon Holdings BV
- Propella Electric Bikes
- Rad Power Bikes
- Ride Aventon Inc.
- Specialized Bicycle Components Inc.
- Trek Bicycle Corporation
- VanMoof
第7章:執行長的關鍵策略問題
第 8 章 附錄
- 世界概況
- 概述
- 五力分析框架
- 全球價值鏈分析
- 市場動態(DRO)
- 資訊來源和進一步閱讀
- 圖片列表
- 關鍵見解
- 資料包
- 詞彙表
The United States E-bike Market size is estimated at 4.06 billion USD in 2025, and is expected to reach 7.49 billion USD by 2029, growing at a CAGR of 16.54% during the forecast period (2025-2029).
Propulsion segment market overview
- The electric vehicle industry is steadily changing the automotive industry's landscape with the introduction of more effective and potent electric automobiles every year. Pedal-assisted and speed pedelec e-bikes are used in a wide range of industries and applications across the United States. They are seen as a cleaner and greener mode of transportation for short distances. Several e-bike producers raised funds for company expansions due to a spike in e-bike imports and sales across the country. According to the Light Electric Vehicle Association, in 2021, 7,900,00 e-bikes were imported into the country, 1.8 times more than in 2020.
- Due to the COVID-19 pandemic, pedal-assisted e-bikes have gained popularity across the country. Consumers have become more interested in their health and well-being. By 2021, 60% of trips in the United States were estimated to be less than 5 miles, which can be easily covered by an e-bike. The COVID-19 pandemic had a mixed impact on the market, with initial lockdowns and shutdowns of manufacturing units resulting in a slump in demand. However, as restrictions eased, demand for e-bikes gained significant momentum, with various dealers in the United States reporting more than a 100% increase in Y-o-Y sales.
- Increasing government investments in bike-sharing programs, bike lanes, and more pedestrian-friendly streets are likely to raise consumer interest in speed pedelec and throttle-assisted e-bikes in the future. During the forecast period, investments in city road infrastructure for e-bikes are also expected to boost the e-bike market. The current investments, funding, and initiatives are helping boost the sales of e-bikes across the country.
United States E-bike Market Trends
The US shows a consistent and strong increase in E-Bike adoption rates, indicating a growing popularity and market expansion.
- Over the past few years, bicycles have gradually become one of the popular modes of daily commuting in the United States. The introduction of e-bikes also surged the demand for bicycles in recent years. Rising pollution and traffic conditions, along with rising fuel prices, have boosted the adoption of e-bikes across the country. E-bikes are gaining popularity among a range of age groups. People between the age of 50 and above are also showing high interest in these bikes. As a result, the adoption rate for e-bikes increased by 2.4% in 2019 compared to 2018.
- The COVID-19 pandemic in 2020 had a positive impact on the US e-bike market. Factors such as social distancing measures and anxiety among people about using public transportation resulted in changing travel preferences among consumers, further boosting the adoption of e-bicycles by 2.7% in 2020 compared to 2019.
- E-bike companies are launching new models with advanced technologies to attract customers in the United States and boost their sales significantly. Consumer preferences for a cleaner and healthier ride while saving fuel costs are also contributing to the higher adoption rate of e-bicycles. Owing to such factors, the country witnessed a rise of 3% in the e-bike adoption rate in 2021 compared to 2020, which is projected to grow by 12.24% during the forecast period.
The US shows a steady increase in the population with a 5-15 km daily travel distance, indicating a consistent commuting pattern.
- Over the past few years, the United States has witnessed significant demand for bicycles. Though there is rising demand for bicycles, their use in the commute of 5-15 km is still low compared to the other modes of transportation, as the majority of people use personal automobiles for office and business commutes. Only 0.6% of the workers across the United States opted for bicycles as a mode of transport in 2019.
- In 2020, millions of Americans rediscovered bicycles as a safe, socially distant method of transportation after the COVID-19 outbreak. The introduction of e-bikes with advanced battery packs that provide an enhanced range of up to 40-45 km is also boosting the demand from consumers who have a daily travel distance of 5-15 km. During the pandemic, bicycles also became a preferred form of exercise among people due to the closure of gyms and fitness clubs.
- However, post the pandemic, many people continued using bicycles to commute to work, offices, businesses, and marketplaces within a range of 5-15 km. More than 15% of the users used bicycles as a mode of transport in 2022. Bicycles offer health benefits, carbon-free rides, no fuel costs, and time-saving in traffic congestion. These benefits are highly contributing to the rising adoption of bicycles, which may further boost the market in the country during the forecast period.
United States E-bike Industry Overview
The United States E-bike Market is fragmented, with the top five companies occupying 30.99%. The major players in this market are Cycling Sports Group, Inc., Giant Manufacturing Co., Pon Holdings B.V., Specialized Bicycle Components Inc. and Trek Bicycle Corporation (sorted alphabetically).
Additional Benefits:
- The market estimate (ME) sheet in Excel format
- 3 months of analyst support
TABLE OF CONTENTS
1 EXECUTIVE SUMMARY & KEY FINDINGS
2 REPORT OFFERS
3 INTRODUCTION
- 3.1 Study Assumptions & Market Definition
- 3.2 Scope of the Study
- 3.3 Research Methodology
4 KEY INDUSTRY TRENDS
- 4.1 Bicycle Sales
- 4.2 GDP Per Capita
- 4.3 Inflation Rate
- 4.4 Adoption Rate Of E-bikes
- 4.5 Percent Population/commuters With 5-15 Km Daily Travel Distance
- 4.6 Bicycle Rental
- 4.7 E-bike Battery Price
- 4.8 Price Chart Of Different Battery Chemistry
- 4.9 Hyper-local Delivery
- 4.10 Dedicated Bicycle Lanes
- 4.11 Number Of Trekkers
- 4.12 Battery Charging Capacity
- 4.13 Traffic Congestion Index
- 4.14 Regulatory Framework
- 4.15 Value Chain & Distribution Channel Analysis
5 MARKET SEGMENTATION (includes market size in Value in USD and Volume, Forecasts up to 2029 and analysis of growth prospects)
- 5.1 Propulsion Type
- 5.1.1 Pedal Assisted
- 5.1.2 Speed Pedelec
- 5.1.3 Throttle Assisted
- 5.2 Application Type
- 5.2.1 Cargo/Utility
- 5.2.2 City/Urban
- 5.2.3 Trekking
- 5.3 Battery Type
- 5.3.1 Lead Acid Battery
- 5.3.2 Lithium-ion Battery
- 5.3.3 Others
6 COMPETITIVE LANDSCAPE
- 6.1 Key Strategic Moves
- 6.2 Market Share Analysis
- 6.3 Company Landscape
- 6.4 Company Profiles
- 6.4.1 Ariel Rider
- 6.4.2 Cycling Sports Group, Inc.
- 6.4.3 Giant Manufacturing Co.
- 6.4.4 Pon Holdings B.V.
- 6.4.5 Propella Electric Bikes
- 6.4.6 Rad Power Bikes
- 6.4.7 Ride Aventon Inc.
- 6.4.8 Specialized Bicycle Components Inc.
- 6.4.9 Trek Bicycle Corporation
- 6.4.10 VanMoof
7 KEY STRATEGIC QUESTIONS FOR E BIKES CEOS
8 APPENDIX
- 8.1 Global Overview
- 8.1.1 Overview
- 8.1.2 Porter's Five Forces Framework
- 8.1.3 Global Value Chain Analysis
- 8.1.4 Market Dynamics (DROs)
- 8.2 Sources & References
- 8.3 List of Tables & Figures
- 8.4 Primary Insights
- 8.5 Data Pack
- 8.6 Glossary of Terms
 全球電動自行車訂閱平台市場:產業分析、規模、佔有率、成長、趨勢與預測(2025-2032年)
 Speed Pedelec 電動自行車:市場佔有率分析、產業趨勢與統計、成長預測(2025-2029 年)中東電動自行車:市場佔有率分析、產業趨勢與統計、成長預測(2025-2029 年)亞太電動自行車:市場佔有率分析、行業趨勢和統計、成長預測(2025-2029 年)北美電動自行車:市場佔有率分析、行業趨勢和統計、成長預測(2025-2030 年)南美電動自行車:市場佔有率分析、行業趨勢和統計、成長預測(2025-2029 年)印度電動自行車:市場佔有率分析、行業趨勢和統計、成長預測(2025-2030 年)德國電動自行車:市場佔有率分析、行業趨勢和統計、成長預測(2025-2029 年)日本電動自行車:市場佔有率分析、行業趨勢和統計、成長預測(2025-2029 年)法國電動自行車:市場佔有率分析、行業趨勢和統計、成長預測(2025-2029 年)