


 |
市場調查報告書
商品編碼
1687130
美國貨運與物流:市場佔有率分析、產業趨勢與統計、成長預測(2025-2030 年)United States Freight and Logistics - Market Share Analysis, Industry Trends & Statistics, Growth Forecasts (2025 - 2030) |
||||||
價格
※ 本網頁內容可能與最新版本有所差異。詳細情況請與我們聯繫。
簡介目錄
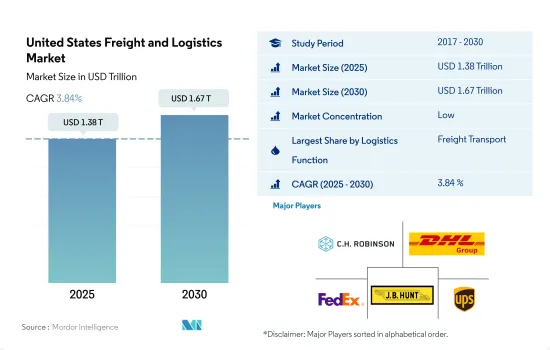
預計 2025 年美國貨運和物流市場規模為 1.38 兆美元,到 2030 年將達到 1.67 兆美元,預測期內(2025-2030 年)的複合年成長率為 3.84%。
美國依靠創新和戰略夥伴關係蓬勃發展
- 2024 年 4 月,UPS 宣布與 USPS 簽訂一份重要的空運契約,深化雙方持續的夥伴關係。經過短暫的過渡期後,UPS 將成為 USPS 的主要空運提供商,並監督USPS 全國範圍內的大部分空運量。此外,2023 年 11 月,UPS 將美國地麵小包裹和 SurePost 遞送的燃油額外費用提高 50 個基點,至 15.25%。同時,OnTrac 將在 2024 年將貨運費率提高 6.2%,並採用分級制度,距離越短,運費越便宜。
- 為加強基礎設施建設,政府根據《兩黨基礎設施法案》(BIL)為高速公路計劃撥款 3500 億美元,並將計劃延長至 2026 年 9 月 30 日。 2022 年至 2026 年期間,BIL累計5,500 億美元用於聯邦對一系列基礎設施領域的投資,包括道路、橋樑、公共交通、供水系統、復原力措施和寬頻服務。截至 2024 年 11 月,該政府已在 BIL 下撥款超過 5,680 億美元,並資助了超過 66,000 個計劃。
美國貨運和物流市場的趨勢
美國在該地區居領先地位,貢獻了 86% 的 GDP,主要得益於基礎設施和供應鏈投資
- 2024年9月,美國運輸部下屬的聯邦航空管理局向519個計劃撥款19億美元。這些計劃遍及 48 個州、關島、波多黎各和其他領土,都是機場改善計畫 (AIP) 的一部分。此外,2023 年還將額外撥款 2.69 億美元自由支配撥款,用於支持美國 56 個機場的 62 個計劃。這項競爭舉措將支持機場所有者和營運商加強美國機場系統。第五輪 AIP 資助是迄今為止最大的一輪,將資助廣泛的計劃,從改善機場安全和永續性到降低噪音。美國各地的機場無論規模大小均可獲得津貼。
- 在基礎設施建設和電子商務繁榮的推動下,運輸和倉儲行業的就業機會預計將激增。美國勞工統計局 (BLS) 預測 2022 年至 2032 年期間年增率為 0.8%,相當於新增約 57 萬個工作機會。值得注意的是,除了倉儲和儲存之外,宅配和信使服務預計將推動約 80% 的就業成長。
2022年,美國將從80個國家進口628萬桶/日原油,繼續成為原油淨進口國。
- 到2024年10月,也就是總統大選前,美國汽油價格預計將三年多來首次跌至每加侖3美元以下。燃料價格預計將會下降,這主要歸因於需求減弱和原油價格下跌,這將為深陷通膨壓力的消費者提供急需的喘息機會。截至 2024 年 9 月,普通汽油的平均價格為每加侖 3.25 美元,比上個月下降 19 美分,比去年同期下降 58 美分。
- 美國能源資訊署(EIA)預計,2024年原油價格將保持穩定,與2023年的水準持平,但2025年將出現下降。預計美國將在2023年增加額外的運作精製,以緩解未來兩年石油產品的價格壓力。同時,科威特和中東其他地區正在建立國際精製能力,進一步緩解全球汽油和柴油的價格壓力。此外,2024 年裂解價差縮小可能導致 2024 年和 2025 年平均零售燃料價格下降,預計 2024 年為每加侖 3.36 美元,2025 年為每加侖 3.24 美元。
美國貨運和物流行業概況
美國貨運代理和物流市場較為分散,市場上主要有五主要企業(按字母順序排列):CH Robinson、DHL Group、FedEx、JB Hunt Transport, Inc. 和 United 物流 Service of 美國 , Inc. (UPS)。
其他福利:
- Excel 格式的市場預測 (ME) 表
- 3 個月的分析師支持
目錄
第 1 章執行摘要和主要發現
第2章 報告要約
第 3 章 簡介
- 研究假設和市場定義
- 研究範圍
- 調查方法
第4章 產業主要趨勢
- 人口統計
- 按經濟活動分類的 GDP 分佈
- 經濟活動帶來的 GDP 成長
- 通貨膨脹率
- 經濟表現及概況
- 電子商務產業趨勢
- 製造業趨勢
- 交通運輸倉儲業生產毛額
- 出口趨勢
- 進口趨勢
- 燃油價格
- 卡車運輸成本
- 卡車持有量(依類型)
- 物流績效
- 主要卡車供應商
- 模態共享
- 海運能力
- 班輪連結性
- 停靠港和演出
- 貨運趨勢
- 貨物噸位趨勢
- 基礎設施
- 法律規範(公路和鐵路)
- 美國
- 法律規範(海運和空運)
- 美國
- 價值鏈與通路分析
第5章 市場區隔
- 最終用戶產業
- 農業、漁業和林業
- 建設業
- 製造業
- 石油和天然氣、採礦和採石
- 批發和零售
- 其他
- 物流功能
- 快遞、快遞和包裹 (CEP)
- 目的地
- 國內的
- 國際的
- 貨物
- 按運輸方式
- 航空
- 海上和內陸水道
- 其他
- 貨物
- 交通方式
- 航空
- 管道
- 鐵路
- 路
- 海上和內陸水道
- 倉庫存放
- 透過溫度控制
- 無溫度控制
- 溫度管理
- 其他服務
- 快遞、快遞和包裹 (CEP)
第6章 競爭格局
- 主要策略趨勢
- 市場佔有率分析
- 業務狀況
- 公司簡介.
- CH Robinson
- Deutsche Bahn AG(including DB Schenker)
- DHL Group
- DSV A/S(De Sammensluttede Vognmaend af Air and Sea)
- Expeditors International of Washington, Inc.
- FedEx
- GXO Logistics
- JB Hunt Transport, Inc.
- Kuehne+Nagel
- NFI Industries
- Penske Corporation(including Penske Logistics)
- United Parcel Service of America, Inc.(UPS)
第7章:執行長的關鍵策略問題
第 8 章 附錄
- 世界概況
- 概述
- 五力分析框架
- 全球價值鏈分析
- 市場動態(市場促進因素、限制因素、機會)
- 技術進步
- 資訊來源和進一步閱讀
- 圖表清單
- 關鍵見解
- 資料包
- 詞彙表
- 外匯
簡介目錄
Product Code: 55459
The United States Freight and Logistics Market size is estimated at 1.38 trillion USD in 2025, and is expected to reach 1.67 trillion USD by 2030, growing at a CAGR of 3.84% during the forecast period (2025-2030).
United States thrives with tech innovations and strategic partnerships
- In April 2024, UPS announced a major air cargo contract with USPS, deepening their ongoing partnership. After a brief transition, UPS will become the primary air cargo provider for USPS, overseeing most of its air shipments nationwide. Additionally, in November 2023, UPS raised its fuel surcharge for US ground parcel and SurePost deliveries by 50 basis points, bringing it to 15.25%. At the same time, OnTrac implemented a 6.2% tariff rate increase for 2024, adopting a tiered system where shorter hauls are charged less than longer ones.
- To bolster infrastructure development, the government allocated USD 350 billion for highway initiatives under the Bipartisan Infrastructure Law (BIL), with projects extending until September 30, 2026. Spanning from 2022 to 2026, BIL earmarked a substantial USD 550 billion for federal investments in diverse infrastructure sectors, including roads, bridges, mass transit, water systems, resilience efforts, and broadband services. By November 2024, the administration had disbursed over USD 568 billion under the BIL, funding more than 66,000 projects and awards.
United States Freight and Logistics Market Trends
United States leads regional GDP with 86% contribution, driven by infrastructure and supply chain investments
- In September 2024, the FAA, under the US Department of Transportation, allocated USD 1.9 billion in grants for 519 projects. These projects span 48 states, Guam, Puerto Rico, and other territories, all part of the Airport Improvement Program (AIP). Additionally, USD 269 million in Supplemental Discretionary Grants for 2023 will back 62 projects at 56 U.S. airports. This competitive initiative aids airport owners and operators in enhancing the U.S. airport system. Marking its largest round yet, this fifth AIP grant cycle funds diverse projects, from airport safety and sustainability upgrades to noise reduction. The grants cater to airports nationwide, regardless of size.
- With infrastructure development and the e-commerce boom, the transportation and storage sector is set for a job surge. The Bureau of Labor Statistics (BLS) projects a 0.8% annual growth rate from 2022 to 2032, translating to nearly 570,000 new jobs. Notably, the couriers and messengers industry, alongside warehousing and storage, is expected to drive about 80% of this job growth.
In 2022, the U.S. imported 6.28 million bpd of crude oil from 80 countries, continuing its streak as a net crude oil importer
- By October 2024, just ahead of the presidential election, U.S. gasoline prices were poised to dip below USD 3 a gallon for the first time in over three years. This anticipated drop in fuel prices, primarily driven by waning demand and declining oil prices, offers a much-needed respite to consumers grappling with inflationary pressures. As of September 2024, regular gas averaged USD 3.25 a gallon, marking a 19-cent decrease from the previous month and a 58-cent drop from the same time last year.
- Crude oil prices, as per the U.S. Energy Information Administration (EIA), remained stable in 2024, mirroring 2023 levels, before expected downturn in 2025. The U.S. bolstered its operable refining capacity in 2023, a move expected to ease price pressures on oil products in the subsequent two years. Meanwhile, Kuwait and other parts of the Middle East are ramping up international refining capacities, further alleviating global price pressures on gasoline and diesel. Additionally, narrowing crack spreads in 2024 could translate to reduced average retail fuel prices in both 2024 and 2025, with projections of USD 3.36/gal in 2024 and USD 3.24/gal in 2025.
United States Freight and Logistics Industry Overview
The United States Freight and Logistics Market is fragmented, with the major five players in this market being C.H. Robinson, DHL Group, FedEx, J.B. Hunt Transport, Inc. and United Parcel Service of America, Inc. (UPS) (sorted alphabetically).
Additional Benefits:
- The market estimate (ME) sheet in Excel format
- 3 months of analyst support
TABLE OF CONTENTS
1 EXECUTIVE SUMMARY & KEY FINDINGS
2 REPORT OFFERS
3 INTRODUCTION
- 3.1 Study Assumptions & Market Definition
- 3.2 Scope of the Study
- 3.3 Research Methodology
4 KEY INDUSTRY TRENDS
- 4.1 Demographics
- 4.2 GDP Distribution By Economic Activity
- 4.3 GDP Growth By Economic Activity
- 4.4 Inflation
- 4.5 Economic Performance And Profile
- 4.5.1 Trends in E-Commerce Industry
- 4.5.2 Trends in Manufacturing Industry
- 4.6 Transport And Storage Sector GDP
- 4.7 Export Trends
- 4.8 Import Trends
- 4.9 Fuel Price
- 4.10 Trucking Operational Costs
- 4.11 Trucking Fleet Size By Type
- 4.12 Logistics Performance
- 4.13 Major Truck Suppliers
- 4.14 Modal Share
- 4.15 Maritime Fleet Load Carrying Capacity
- 4.16 Liner Shipping Connectivity
- 4.17 Port Calls And Performance
- 4.18 Freight Pricing Trends
- 4.19 Freight Tonnage Trends
- 4.20 Infrastructure
- 4.21 Regulatory Framework (Road and Rail)
- 4.21.1 United States
- 4.22 Regulatory Framework (Sea and Air)
- 4.22.1 United States
- 4.23 Value Chain & Distribution Channel Analysis
5 MARKET SEGMENTATION (includes 1. Market value in USD for all segments 2. Market volume for select segments viz. freight transport, CEP (courier, express, and parcel) and warehousing & storage 3. Forecasts up to 2030 and analysis of growth prospects)
- 5.1 End User Industry
- 5.1.1 Agriculture, Fishing, and Forestry
- 5.1.2 Construction
- 5.1.3 Manufacturing
- 5.1.4 Oil and Gas, Mining and Quarrying
- 5.1.5 Wholesale and Retail Trade
- 5.1.6 Others
- 5.2 Logistics Function
- 5.2.1 Courier, Express, and Parcel (CEP)
- 5.2.1.1 By Destination Type
- 5.2.1.1.1 Domestic
- 5.2.1.1.2 International
- 5.2.2 Freight Forwarding
- 5.2.2.1 By Mode Of Transport
- 5.2.2.1.1 Air
- 5.2.2.1.2 Sea and Inland Waterways
- 5.2.2.1.3 Others
- 5.2.3 Freight Transport
- 5.2.3.1 By Mode Of Transport
- 5.2.3.1.1 Air
- 5.2.3.1.2 Pipelines
- 5.2.3.1.3 Rail
- 5.2.3.1.4 Road
- 5.2.3.1.5 Sea and Inland Waterways
- 5.2.4 Warehousing and Storage
- 5.2.4.1 By Temperature Control
- 5.2.4.1.1 Non-Temperature Controlled
- 5.2.4.1.2 Temperature Controlled
- 5.2.5 Other Services
- 5.2.1 Courier, Express, and Parcel (CEP)
6 COMPETITIVE LANDSCAPE
- 6.1 Key Strategic Moves
- 6.2 Market Share Analysis
- 6.3 Company Landscape
- 6.4 Company Profiles (includes Global Level Overview, Market Level Overview, Core Business Segments, Financials, Headcount, Key Information, Market Rank, Market Share, Products and Services, and Analysis of Recent Developments).
- 6.4.1 C.H. Robinson
- 6.4.2 Deutsche Bahn AG (including DB Schenker)
- 6.4.3 DHL Group
- 6.4.4 DSV A/S (De Sammensluttede Vognmaend af Air and Sea)
- 6.4.5 Expeditors International of Washington, Inc.
- 6.4.6 FedEx
- 6.4.7 GXO Logistics
- 6.4.8 J.B. Hunt Transport, Inc.
- 6.4.9 Kuehne+Nagel
- 6.4.10 NFI Industries
- 6.4.11 Penske Corporation (including Penske Logistics)
- 6.4.12 United Parcel Service of America, Inc. (UPS)
7 KEY STRATEGIC QUESTIONS FOR FREIGHT AND LOGISTICS CEOS
8 APPENDIX
- 8.1 Global Overview
- 8.1.1 Overview
- 8.1.2 Porter's Five Forces Framework
- 8.1.3 Global Value Chain Analysis
- 8.1.4 Market Dynamics (Market Drivers, Restraints & Opportunities)
- 8.1.5 Technological Advancements
- 8.2 Sources & References
- 8.3 List of Tables & Figures
- 8.4 Primary Insights
- 8.5 Data Pack
- 8.6 Glossary of Terms
- 8.7 Currency Exchange Rate
02-2729-4219
+886-2-2729-4219
 印尼貨運與物流:市場佔有率分析、產業趨勢與統計、成長預測(2025-2030 年)
 德國貨運與物流:市場佔有率分析、產業趨勢與統計、成長預測(2025-2030 年)
 日本的貨運和物流:市場佔有率分析、行業趨勢和統計、成長預測(2025-2030 年)
 法國貨運與物流:市場佔有率分析、產業趨勢與統計、成長預測(2025-2030 年)
 泰國貨運與物流:市場佔有率分析、產業趨勢與統計、成長預測(2025-2030 年)
 越南貨運與物流:市場佔有率分析、產業趨勢與統計、成長預測(2025-2030 年)
 馬來西亞貨運與物流:市場佔有率分析、產業趨勢與統計、成長預測(2025-2030 年)
 綠色船舶運輸技術市場評估:服務類型·終端用戶產業·各地區的機會及預測 (2018-2032年)
 2025-2033 年日本貨運物流市場規模、佔有率、趨勢和預測(按類型、最終用戶和地區分類)
 全球貨運物流市場
▼