


 |
市場調查報告書
商品編碼
1645129
美國軟性飲料包裝:市場佔有率分析、行業趨勢和統計、成長預測(2025-2030 年)US Soft Drinks Packaging - Market Share Analysis, Industry Trends & Statistics, Growth Forecasts (2025 - 2030) |
||||||
價格
※ 本網頁內容可能與最新版本有所差異。詳細情況請與我們聯繫。
簡介目錄
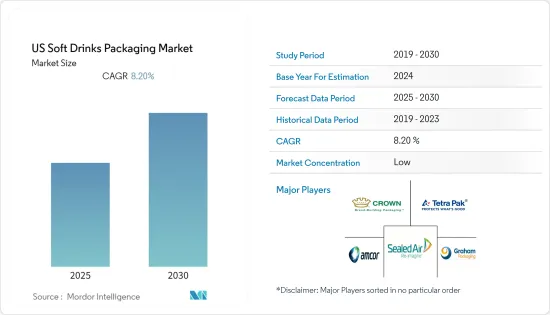
預計預測期內美國軟性飲料包裝市場複合年成長率為 8.20%。
主要亮點
- 在消費者對更健康生活方式的追求的推動下,瓶裝水將取代碳酸飲料,成為美國消費者的首選包裝飲料。由於健康飲料的趨勢威脅到碳酸軟性飲料的成長,因此,透過包裝激勵措施找到新的創新方法來提高消費者的購買意願對於包裝製造商和品牌所有者來說至關重要。然而,成本可能是使新包裝成為現實的一個重要因素。
- 寶特瓶水產業的每個領域都在成長,寶特瓶水被認為是美國最成功的大眾市場飲料類別。
- 此外,在紐約、波士頓、洛杉磯、舊金山、拉斯維加斯、休士頓、邁阿密和華盛頓特區等 17 個主要城市,瓶裝水的銷量超過了零售軟性飲料。預計會有更多城市加入這項名單。
- 大多數碳酸飲料都裝在鋁罐或寶特瓶出售。它也在食品服務業的汽水供應機大量銷售。只有一小部分的碳酸飲料是裝在玻璃瓶中。由於消費者偏好和生活方式的變化,這些產品的包裝尺寸通常較小,而且與大容量的寶特瓶和鋁罐相比,運輸沉重、小容量的玻璃容器會導致成本增加。
- 此外,軟性飲料是繼水之後消費量第二大的飲料,而軟性飲料最常用的包裝材料是塑膠。許多飲料製造商傾向於使用塑膠包裝來包裝瓶裝飲料,因為它重量輕、耐用且具有成本效益。
- 此外,碳酸飲料通常裝在鋁罐中。新冠疫情在疫情初期就影響了這些罐頭的供應,凸顯了它們的限制。這種罐裝短缺促使汽水製造商尋找新的包裝,尤其是任何可以延長保存期限的無菌包裝。
美國軟性飲料包裝市場趨勢
塑膠有望佔據主要市場佔有率
- 與替代材料相比,塑膠生產更節能、更輕,使其成為比其他替代材料更有效的軟性飲料包裝材料。例如,僅 2 磅塑膠就可以提供 10 加侖液體,即牛奶,而需要 3 磅鋁、8 磅鋼和超過 40 磅玻璃才能提供相同量的液體。
- 由於需求增加,即飲冰茶正在經歷強勁成長。市面上的商販提供專門用於即飲茶的再生包裝。例如,Graham Packaging 提供可回收塑膠包裝以延長其單份包裝的保存期限。
- 此外,由於上班族生活繁忙,各品牌都推出了單份塑膠小袋裝產品。因此,即飲飲料變得越來越重要,進一步推動了市場的成長。
- HDPE是應用最廣泛的塑膠包裝材料。它用於製造多種類型的瓶子和容器。無色瓶子半透明、阻隔性,非常適合包裝果汁和能量飲料等保存期限較短的產品。
- 隨著軟性飲料市場的擴大,人們對果汁、能量飲料、運動飲料等營養產品的需求日益增加,這顯然直接推動了軟性飲料包裝市場的發展。塑膠也非常耐用且易於攜帶。此外,塑膠是密封的,因此不太可能發生洩漏或變質。
碳酸飲料佔最大市場佔有率
- 碳酸飲料市場是全球成熟的產業之一。過去幾年來,該行業的產品創新和交付發生了重大變化。為了應對日益嚴峻的市場挑戰,各公司在提供新口味的同時,也考慮到消費者對健康和保健的關注。
- 在美國,碳酸飲料是僅次於水的第二大消費量飲料,而塑膠是軟性飲料包裝最常用的材料。人口成長和可支配收入增加推動了碳酸飲料產品的需求。
- 大多數碳酸飲料都裝在鋁罐和寶特瓶出售。它也在食品服務業的汽水供應機大量銷售。只有一小部分的碳酸飲料是裝在玻璃瓶中。這是因為,隨著消費者的偏好和生活方式變化,與容積率較高的寶特瓶和鋁罐相比,重量較重且容積較小的玻璃容器的運輸成本有所增加。
- 此外,可樂軟性飲料是2020年美國最受歡迎的碳酸飲料。銷售額突破130億美國。柑橘類碳酸飲料則位居第二,銷售額約46億美元。
- 此外,高效能的包裝解決方案易於使用、易於處理並能改善使用者體驗。這些優勢導致了軟性飲料領域對包裝解決方案的需求。推動需求的另一個趨勢是新穎和創新的產品,幫助製造商區分他們的產品同時提高品牌知名度。
美國軟性飲料包裝產業概況
美國軟性飲料包裝市場高度分散,擁有許多國內和國際參與者。市場較為分散,參與者在價格、產品設計、產品創新等方面競爭。市場的主要企業包括 Amcor Ltd、Sealed Air Corporation、Tetra Pak International、Graham Packaging Company 和 Crown Holdings Incorporated。
- 2021 年 7 月-希悅爾已承諾投入超過 3,000 萬美元的資金來擴大其全球生產能力並投資新的設備系統,以滿足對其自動包裝系統品牌解決方案日益成長的需求。這項投資主要用於擴大俄亥俄州斯特里茨伯勒和貝德福德高地以及西維吉尼亞凱澤的產能,以及「非接觸式」自動化和專有數位印刷技術,預計將於 2021 年完成。
- 2021 年 2 月-利樂推出經過認證的再生聚合物,成為食品和飲料包裝行業第一家獲得永續生物材料圓桌會議 (RSB) 高級產品認證的公司。目前,採用可回收聚合物製成的紙箱包裝正在出售給食品和飲料製造商。
其他福利:
- Excel 格式的市場預測 (ME) 表
- 3 個月的分析師支持
目錄
第 1 章 簡介
- 研究假設和市場定義
- 研究範圍
第2章調查方法
第3章執行摘要
第4章 市場洞察
- 市場概況
- 產業價值鏈分析
- 產業吸引力-波特五力分析
- 供應商的議價能力
- 買家的議價能力
- 新進入者的威脅
- 替代品的威脅
- 競爭對手之間的競爭強度
- COVID-19 市場影響評估
第5章 市場動態
- 市場促進因素
- 即飲飲料需求不斷成長
- 消費者對便利包裝的需求不斷增加
- 市場限制
- 與塑膠使用相關的環境問題
- 嚴格的政府法規
第6章 市場細分
- 依包裝材料類型
- 塑膠
- 紙和紙板
- 玻璃
- 金屬
- 其他材料
- 依產品類型
- 瓶裝水
- 碳酸飲料
- 汁
- 即飲飲料
- 運動飲料
- 其他產品
第7章 競爭格局
- 公司簡介
- Crown Holdings Inc.
- Amcor Ltd.
- Tetra Pak International
- Sealed Air Corporation
- Graham Packaging Company
- Ball Corporation
- Placon Corporation
- Toyo Seikan Group Holdings Ltd
- WestRock Company
- Owens-Illinois Inc.
- Refresco Group NV
- Ardagh Group SA
- CAN-PACK SA
第8章投資分析
第9章:未來市場展望
簡介目錄
Product Code: 54340
The US Soft Drinks Packaging Market is expected to register a CAGR of 8.20% during the forecast period.
Key Highlights
- Driven by consumer desire for a healthier lifestyle, bottled water will overtake carbonated soft drinks as the leading packaged beverage of choice among U.S. consumers. With trends toward healthier beverages threatening the growth of carbonated soft drinks, finding new and innovative ways to get consumers to buy through packaging stimuli will be crucial for packaging manufacturers and brand owners. However, the cost will still be the key ingredient to any new packaging feasibility.
- Every segment of the bottled water industry is growing, and bottled water is considered the most successful mass-market beverage category in the U.S. Single-serve PET plastic bottled water outperformed all other beverage categories, posting another significant rise.
- Further, bottled water outsells retail soft drinks in 17 major cities, including New York, Boston, Los Angeles, San Francisco, Las Vegas, Houston, Miami, and Washington D.C. Overall, soft drink consumption declines. More cities are projected will join the list.
- The majority of carbonated soft drinks are sold in aluminum cans and PET bottles. They are also sold in bulk in the foodservice industry through soda fountains. Only a tiny portion of CSDs are still packaged in glass bottles. These are usually packaged in smaller sizes due to changing consumer preferences and lifestyles and increased costs associated with transporting heavy, low-volume glass containers versus high volume-to-packaging ratio PET bottles and aluminum cans.
- Moreover, soft drinks are the second most-consumed drink after water, with plastic being the most used material for soft drinks packaging. Many beverage companies favor plastic packaging material for bottled beverages due to its lightweight, durability, and cost-efficiency.
- Further, carbonated soft drinks are usually packaged in aluminum cans. The COVID-19 pandemic impacted the supply of these cans in the early months of the pandemic, which highlighted the limitations of these cans. The can shortage made carbonated beverage producers look for new packages, specifically all forms of aseptic, enabling a long ambient shelf life.
US Soft Drinks Packaging Market Trends
Plastic is Expected to Hold Significant Market Share
- Plastics are a more efficient material for soft drinks packaging than other alternatives because plastics are energy efficient to manufacture and lighter than alternative materials. For instance, just two pounds of plastic can deliver 10 gallons of Liquid, i.e., milk, whereas three pounds of aluminum, eight pounds of steel, or over 40 pounds of glass are needed to deliver the same amount of Liquid.
- Ready-to-drink iced tea has grown considerably due to the increasing demand. Market vendors are offering specialized recycle packaging for ready-to-drink tea. For instance, Graham Packaging offers recyclable plastic packaging to provide longer shelf life for single-serve packaging.
- Also, the busy life of working people has led to the launch of single-serve plastic sachets by various brands. Thus, this increases the importance of ready-to-consume drinks and further boosts market growth.
- HDPE is the most widely used type of plastic packaging material. It is used to make many types of bottles and containers. Unpigmented bottles are translucent and sturdy, have good barrier properties, and are well suited for packaging products with a shorter shelf life, such as Juices and Energy Drinks.
- With the expanding soft drinks market, it is evident that nutritional product demand, such as Juices, Energy drinks, sports drinks, is increasing, directly driving the soft drinks packaging market. It is also durable, and people can carry them without hassle. Moreover, plastics are airtight, so leakage and getting stale is unlikely.
Carbonated Beverages to hold the Largest Market Share
- The carbonated beverages market is one of the matured industries across the globe. The segment has undergone significant changes in product innovations and offerings in the last few years. To face the growing market challenges, companies are bringing new flavors keeping in mind consumers' health and wellness concerns.
- In the United States, carbonated drinks are the second most-consumed drink after water, with plastic being the most used material for soft drinks packaging. The increasing population and rising disposable income have led to the increasing demand for carbonated soft drinks products.
- The majority of carbonated soft drinks are sold in aluminum cans and PET bottles. They are also sold in bulk in the foodservice industry through soda fountains. Only a tiny portion of CSDs are still packaged in glass bottles. These are usually packaged in smaller sizes due to changing consumer preferences and lifestyles and increased costs associated with transporting heavy, low-volume glass containers versus high volume-to-packaging ratio PET bottles and aluminum cans.
- Moreover, Cola style soft drinks were the most popular carbonated beverage in the United States in 2020. The sales reached over 13 billion U.S. dollars. Citrus carbonated soft drink varieties ranked second, with sales amounting to around 4.6 billion U.S. dollars.
- Further, efficient packaging solutions offer ease of use, disposability, and enhanced user experience. These benefits have led to the demand for packaging solutions for the soft drinks segment. The other trend augmenting the demand is the new and innovative products, which helps manufacturers enhance their brand visibility while offering product differentiation.
US Soft Drinks Packaging Industry Overview
The US Soft Drinks Packaging market is highly fragmented, owing to many domestic and international players. The market is fragmented, with the players competing in terms of price, product design, product innovation, etc. Some of the major players in the market are Amcor Ltd, Sealed Air Corporation, Tetra Pak International, Graham Packaging Company, Crown Holdings Incorporated, among others.
- July 2021 - Sealed Air Corporation has dedicated more than USD b30 million in capital to expand global production capacity and invest in new equipment systems to meet the accelerating demand for Automated Packaging Systems brand solutions. The investment is for capacity expansion, 'touchless' automation, and proprietary digital printing technologies, primarily in Streetsboro and Bedford Heights, Ohio, and Keyser, West Virginia, and will be completed in 2021.
- February 2021 - Tetra Pak introduced certified recycled polymers and became the first company in the food and beverage packaging industry to be awarded the Roundtable on Sustainable Biomaterials (RSB) Advanced Products certification. Its carton packages integrating attributed recycled polymers are now available for food and beverage manufacturers.
Additional Benefits:
- The market estimate (ME) sheet in Excel format
- 3 months of analyst support
TABLE OF CONTENTS
1 INTRODUCTION
- 1.1 Study Assumptions and Market Definition
- 1.2 Scope of the Study
2 RESEARCH METHODOLOGY
3 EXECUTIVE SUMMARY
4 MARKET INSIGHTS
- 4.1 Market Overview
- 4.2 Industry Value Chain Analysis
- 4.3 Industry Attractiveness - Porter's Five Forces Analysis
- 4.3.1 Bargaining Power of Suppliers
- 4.3.2 Bargaining Power of Buyers
- 4.3.3 Threat of New Entrants
- 4.3.4 Threat of Substitute Products
- 4.3.5 Intensity of Competitive Rivalry
- 4.4 Assessment of the Impact of COVID-19 on the market
5 MARKET DYNAMICS
- 5.1 Market Drivers
- 5.1.1 Growing Demand for Ready-to-use Drinks
- 5.1.2 Increased demand for convenience packaging from consumers
- 5.2 Market Restraints
- 5.2.1 Environmental concerns regarding usage of plastic
- 5.2.2 Stringent Government Regulations
6 MARKET SEGMENTATION
- 6.1 By Packaging Material Type
- 6.1.1 Plastic
- 6.1.2 Paper & Paperboard
- 6.1.3 Glass
- 6.1.4 Metal
- 6.1.5 Other Materials
- 6.2 By Product Type
- 6.2.1 Bottled Water
- 6.2.2 Carbonated Drinks
- 6.2.3 Juices
- 6.2.4 RTD Beverages
- 6.2.5 Sports Drink
- 6.2.6 Other Products
7 COMPETITIVE LANDSCAPE
- 7.1 Company Profiles
- 7.1.1 Crown Holdings Inc.
- 7.1.2 Amcor Ltd.
- 7.1.3 Tetra Pak International
- 7.1.4 Sealed Air Corporation
- 7.1.5 Graham Packaging Company
- 7.1.6 Ball Corporation
- 7.1.7 Placon Corporation
- 7.1.8 Toyo Seikan Group Holdings Ltd
- 7.1.9 WestRock Company
- 7.1.10 Owens-Illinois Inc.
- 7.1.11 Refresco Group NV
- 7.1.12 Ardagh Group SA
- 7.1.13 CAN-PACK S.A.
8 INVESTMENT ANALYSIS
9 FUTURE OUTLOOK OF THE MARKET
02-2729-4219
+886-2-2729-4219
 中東和非洲軟性飲料包裝:市場佔有率分析、產業趨勢、成長預測(2025-2030)
 亞太地區飲料包裝:市場佔有率分析、產業趨勢、成長預測(2025-2030)
 北美軟性飲料包裝:市場佔有率分析、行業趨勢和成長預測(2025-2030 年)
 北美飲料包裝:市場佔有率分析、產業趨勢與成長預測(2025-2030)
 拉丁美洲軟性飲料包裝:市場佔有率分析、行業趨勢和成長預測(2025-2030 年)
 歐洲軟性飲料包裝:市場佔有率分析、產業趨勢、成長預測(2025-2030)
 美國飲料包裝:市場佔有率分析、產業趨勢與統計、成長預測(2025-2030)
 軟性飲料包裝:市場佔有率分析、產業趨勢、成長預測(2025-2030)
 酒精飲料包裝:市場佔有率分析、產業趨勢與統計、成長預測(2025-2030)
 飲料包裝機市場機會、成長動力、產業趨勢分析及 2025 - 2034 年預測
▼