


 |
市場調查報告書
商品編碼
1685800
亞太貨運與物流-市場佔有率分析、產業趨勢與統計、成長預測(2025-2030 年)Asia Pacific Freight and Logistics - Market Share Analysis, Industry Trends & Statistics, Growth Forecasts (2025 - 2030) |
||||||
價格
※ 本網頁內容可能與最新版本有所差異。詳細情況請與我們聯繫。
簡介目錄
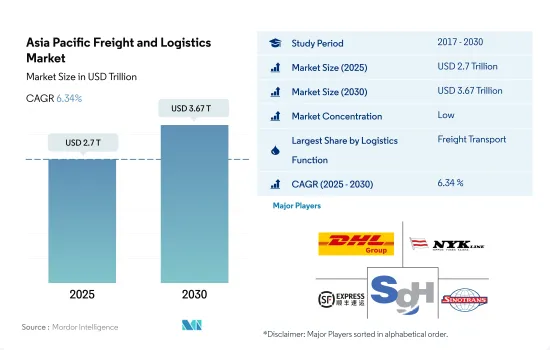
亞太貨運和物流市場規模預計在 2025 年達到 2.7 兆美元,預計到 2030 年將達到 3.67 兆美元,預測期內(2025-2030 年)的複合年成長率為 6.34%。
亞洲開發銀行支持該國基礎建設以刺激貨物運輸需求
- 自2023年3月以來,中國浙江省寧波附近的兩個主要貨櫃卡車堆場一直存在近3,000輛閒置車輛的過剩問題。橫浦和北崙這兩個船廠與港口的運作密切相關。然而,過去兩年這些港口的運輸量大幅下降。貨櫃堆積的原因包括中國倉儲成本低、疫情引發的出口熱潮期間貨櫃供應量激增,以及熱潮消退後大量貨櫃回流。
- 亞洲開發銀行(ADB)積極支持太平洋發展中成員國互聯互通基礎建設工作,包括規劃、建設和維護。光是交通運輸計劃就佔亞銀在太平洋地區投資總額的59%以上。亞銀的大力支持正在促進太平洋地區實現更強勁、更永續的成長軌跡。展望未來,亞銀對太平洋運輸領域的投資預計將超過 16 億美元,並計劃在 2022 年至 2024 年期間資助 22 個計劃,其中包括 1.15 億美元的聯合融資。
在亞太地區建立永續、有韌性的貨運和物流業
- 在印度,運輸成本在物流中占主導地位,佔物流總成本的62%和GDP的14%。鑑於柴油成本佔運輸成本的很大一部分,採用零排放卡車(ZET)可以在車輛的整個使用壽命內顯著降低燃料成本,最高可達 46%。這對印度經濟有著深遠的影響。尤其是公路貨運,目前已佔石油進口費用的四分之一以上,預計到 2050 年將成長四倍。透過採用 ZET,印度到 2050 年可以節省高達 8,380 億公升柴油,相當於減少 1,401.7 億美元的石油支出。
- 由於新增供應有限、設施老化以及線上零售激增導致的消費者偏好變化,預計到 2032 年,亞太地區冷藏倉儲投資將達到每年 50 億美元。這一激增主要是由於該地區對低溫運輸倉庫的需求不斷成長。
亞太貨運及物流市場趨勢
亞太地區的貨運需求受到全球海運貿易的推動,引發了對運輸業的投資。
- 2024 年 5 月 17 日,在日本東京車站舉行的展覽會上,人們重點關注高速客運列車在輕型貨運中的應用日益增加。這一轉變是由於商業駕駛人短缺和新的加班法導致公路運輸成本增加高達 20%。自 2023 年 8 月起,JR 東日本將使用 12 節車廂的 E 系列專用列車實施從新潟到東京的當日送貨服務。運送的物品包括生鮮食品、糖果零食、飲料、鮮花、精密零件、醫療用品等。 2023 年 9 月,JR 東日本在東北新幹線推出了貨運專用服務,目前在其高速和特快網路上提供「Hako BYUN」品牌貨運服務。
- 中國在其「十四五」規劃(2021-2025年)中公佈了擴大交通網路的目標。到2025年,高鐵里程由2020年的3.8萬公里增加到5萬公里,250公里線路覆蓋95%的50萬人口以上城市。到2025年,全國鐵路營業里程將達到16.5萬公里,民用機場270個以上,都市區地鐵營業里程將達到1萬公里,高速公路營業里程將達到19萬公里,高等級內河航道營業里程將達到1.85萬公里。主要目標是到2025年實現一體化發展,重點是轉變交通運輸體系並提高其對GDP的貢獻。
由於大多數亞洲國家都是石油淨進口國,全球不確定性導致油價上漲。
- 2023年,受俄烏戰爭導致全球油價上漲影響,中國原油進口量增加11%,至5.6399億噸。 2024年初,由於中國利用早期價格下跌的機會,進口量與前一年同期比較增5.1%,達到8,831萬噸。布蘭特原油期貨在2023年9月達到97.69美元,12月跌至72.29美元,2024年3月升至84.05美元。 OPEC+決定將減產協議延長至2024年3月,可能會推高油價,並引發對全球需求的擔憂,減緩2024年下半年中國的進口。
- 澳洲聯邦政府將於 2025 年 1 月 1 日起實施針對乘用車和輕型商用車的新燃油效率標準。在此之前,在起草新法律之前,經過了為期一個月的諮詢期。該標準是 2023 年預算的一部分,與 2023 年 4 月發布的電動車策略相關聯,將為汽車製造商設定平均二氧化碳目標。這些目標將逐步降低,要求生產更省油、低排放氣體和零排放的汽車。
亞太貨運及物流業概況
亞太貨運和物流市場較為分散,五大主要參與者分別為 DHL 集團、日本郵船、順豐速運 (KEX-SF)、SG 控股和中國外運(按字母順序排列)。
其他福利
- Excel 格式的市場預測 (ME) 表
- 3個月的分析師支持
目錄
第1章執行摘要和主要發現
第2章 報告要約
第3章 引言
- 研究假設和市場定義
- 研究範圍
- 調查方法
第4章 產業主要趨勢
- 人口統計
- 按經濟活動分類的GDP分佈
- 經濟活動GDP成長
- 通貨膨脹率
- 經濟表現及概況
- 電子商務產業趨勢
- 製造業趨勢
- 交通運輸倉儲業GDP
- 出口趨勢
- 進口趨勢
- 燃油價格
- 卡車運輸成本
- 卡車持有量(按類型)
- 物流績效
- 主要卡車供應商
- 模態共享
- 海運能力
- 班輪連結性
- 停靠港和表演
- 貨運趨勢
- 貨物噸位趨勢
- 基礎設施
- 法律規範(公路和鐵路)
- 澳洲
- 中國
- 印度
- 印尼
- 日本
- 馬來西亞
- 泰國
- 越南
- 法律規範(海事和航空)
- 澳洲
- 中國
- 印度
- 印尼
- 日本
- 馬來西亞
- 泰國
- 越南
- 價值鍊和通路分析
第5章市場區隔
- 最終用戶產業
- 農業、漁業和林業
- 建設業
- 製造業
- 石油和天然氣、採礦和採石
- 批發和零售
- 其他
- 物流功能
- 快遞、快遞和小包裹(CEP)
- 目的地
- 國內的
- 國際的
- 貨物
- 按交通方式
- 航空
- 海上和內陸水道
- 其他
- 貨物
- 交通方式
- 航空
- 管道
- 鐵路
- 路
- 海上和內陸水道
- 倉庫存放
- 溫度管理
- 無溫度控制
- 溫度管理
- 其他服務
- 快遞、快遞和小包裹(CEP)
- 國家
- 澳洲
- 中國
- 印度
- 印尼
- 日本
- 馬來西亞
- 泰國
- 越南
- 其他亞太地區
第6章競爭格局
- 關鍵策略趨勢
- 市場佔有率分析
- 商業狀況
- 公司簡介.
- Alps Logistics
- CH Robinson
- Deutsche Bahn AG(including DB Schenker)
- DHL Group
- DP World
- DSV A/S(De Sammensluttede Vognmaend af Air and Sea)
- Expeditors International of Washington, Inc.
- FedEx
- Kuehne+Nagel
- NYK(Nippon Yusen Kaisha)Line
- SF Express(KEX-SF)
- SG Holdings Co., Ltd.
- SINOTRANS
- United Parcel Service of America, Inc.(UPS)
第7章:CEO面臨的關鍵策略問題
第 8 章 附錄
- 世界概況
- 概述
- 五力分析框架
- 全球價值鏈分析
- 市場動態(市場促進因素、限制因素、機會)
- 技術進步
- 資訊來源及延伸閱讀
- 圖表清單
- 關鍵見解
- 資料包
- 詞彙表
- 外匯
簡介目錄
Product Code: 47682
The Asia Pacific Freight and Logistics Market size is estimated at 2.7 trillion USD in 2025, and is expected to reach 3.67 trillion USD by 2030, growing at a CAGR of 6.34% during the forecast period (2025-2030).
Asian Development Bank assists the infrastructure development in the country, boosting freight transport demand
- Since March 2023, two major container truck yards in Zhejiang province, China, near Ningbo, have grappled with an excess of nearly 3,000 idle vehicles. These yards, Hengpu and Beilun, are closely tied to the port's operations. However, they have experienced a notable decline in traffic over the past two years. The accumulation of containers can be attributed to factors such as China's low storage costs, a surge in container supply during the pandemic's export boom, and a significant number of containers returning after the boom subsided.
- The Asian Development Bank (ADB) is actively supporting Pacific DMCs (Developing Member Countries) in their endeavors related to connectivity infrastructure, including planning, construction, and maintenance. Transport projects alone account for over 59% of the ADB's portfolio in the Pacific. This robust support from the ADB is fostering a more robust and sustainable growth trajectory in the Pacific region. Looking ahead, ADB's investments in the Pacific's transportation sector are projected to surpass USD 1.6 billion, with 22 projects slated for funding during 2022-2024, including a notable USD 115 million in co-financing.
Building a sustainable and resilient freight and logistics sector in the Asia Pacific region
- In India, transportation costs dominate the logistics landscape, accounting for 62% of overall logistics costs and 14% of the country's GDP. Given that diesel fuel costs make up the lion's share of transportation expenses, the adoption of zero-emission trucks (ZETs) can significantly slash fuel costs by up to 46% over the vehicle's lifespan. This has far-reaching implications for India's economy. Notably, road freight, which already accounts for over a quarter of oil import expenses, is projected to surge fourfold by 2050. By embracing ZETs, India could potentially save a staggering 838 billion liters of diesel by 2050, translating to a reduction of USD 140.17 billion in oil expenditures.
- With a confluence of factors such as limited new supply, outdated facilities, and evolving consumer preferences driven by the surge in online retail, investments in cold storage properties in the Asia-Pacific were projected to hit USD 5 billion annually by 2032. This surge is primarily driven by the escalating demand for cold chain warehousing in the region.
Asia Pacific Freight and Logistics Market Trends
Asia Pacific freight demands driven by global seaborne trade, which is triggering transport sector investments
- On May 17, 2024, a fair at Tokyo Station in Japan highlighted the growing use of high-speed passenger trains for light freight. This shift, driven by a shortage of commercial drivers and new overtime laws, has increased road delivery costs by up to 20%. Since August 2023, JR East has been running a same-day delivery service from Niigata to Tokyo using a dedicated 12-car Series E trainset. Items transported include fresh food, confectionery, drinks, flowers, precision components, and medical supplies. In September 2023, JR East launched a freight-only service on the Tohoku Shinkansen and now offers Hakobyun-branded freight services across its high-speed and Limited Express networks.
- In the 14th Five-Year Plan (2021-2025), China revealed goals for expanding its transportation network. By 2025, high-speed railways will extend to 50,000 kms, up from 38,000 kms in 2020, with 95% of cities with populations above 500,000 covered by 250-km lines. The country aims to increase its railway length to 165,000 kms, civil airports to over 270, subway lines in cities to 10,000 kms, expressways to 190,000 kms, and high-level inland waterways to 18,500 kms by 2025. The primary objective is to achieve integrated development by 2025, emphasizing advancements in the transformation of the transportation system and its contribution to GDP.
Owing to global uncertainties, crude oil prices are soaring in the Asian economies as most of them are net oil importers
- In 2023, China's crude oil imports rose by 11% to 563.99 MMT, driven by higher global oil prices due to the Russia-Ukraine War. In early 2024, imports increased by 5.1% YoY, reaching 88.31 MMT, as China capitalized on lower prices earlier. Brent futures peaked at USD 97.69 in September 2023, dropped to USD 72.29 in December, and rose to USD 84.05 by March 2024. OPEC+'s decision in March 2024 to extend output cuts has further boosted prices, raising concerns about global demand and potentially slowing China's imports in H2 2024.
- Australia's federal government will introduce a new fuel efficiency standard for passenger and light commercial vehicles starting January 1, 2025. This follows a one-month consultation period before drafting the new laws. Announced as part of the 2023 budget and linked to the EV strategy released in April 2023, the standard sets average CO2 targets for vehicle manufacturers. These targets will gradually decrease, requiring the production of more fuel-efficient and low or zero-emissions vehicles.
Asia Pacific Freight and Logistics Industry Overview
The Asia Pacific Freight and Logistics Market is fragmented, with the major five players in this market being DHL Group, NYK (Nippon Yusen Kaisha) Line, SF Express (KEX-SF), SG Holdings Co., Ltd. and SINOTRANS (sorted alphabetically).
Additional Benefits:
- The market estimate (ME) sheet in Excel format
- 3 months of analyst support
TABLE OF CONTENTS
1 EXECUTIVE SUMMARY & KEY FINDINGS
2 REPORT OFFERS
3 INTRODUCTION
- 3.1 Study Assumptions & Market Definition
- 3.2 Scope of the Study
- 3.3 Research Methodology
4 KEY INDUSTRY TRENDS
- 4.1 Demographics
- 4.2 GDP Distribution By Economic Activity
- 4.3 GDP Growth By Economic Activity
- 4.4 Inflation
- 4.5 Economic Performance And Profile
- 4.5.1 Trends in E-Commerce Industry
- 4.5.2 Trends in Manufacturing Industry
- 4.6 Transport And Storage Sector GDP
- 4.7 Export Trends
- 4.8 Import Trends
- 4.9 Fuel Price
- 4.10 Trucking Operational Costs
- 4.11 Trucking Fleet Size By Type
- 4.12 Logistics Performance
- 4.13 Major Truck Suppliers
- 4.14 Modal Share
- 4.15 Maritime Fleet Load Carrying Capacity
- 4.16 Liner Shipping Connectivity
- 4.17 Port Calls And Performance
- 4.18 Freight Pricing Trends
- 4.19 Freight Tonnage Trends
- 4.20 Infrastructure
- 4.21 Regulatory Framework (Road and Rail)
- 4.21.1 Australia
- 4.21.2 China
- 4.21.3 India
- 4.21.4 Indonesia
- 4.21.5 Japan
- 4.21.6 Malaysia
- 4.21.7 Thailand
- 4.21.8 Vietnam
- 4.22 Regulatory Framework (Sea and Air)
- 4.22.1 Australia
- 4.22.2 China
- 4.22.3 India
- 4.22.4 Indonesia
- 4.22.5 Japan
- 4.22.6 Malaysia
- 4.22.7 Thailand
- 4.22.8 Vietnam
- 4.23 Value Chain & Distribution Channel Analysis
5 MARKET SEGMENTATION (includes 1. Market value in USD for all segments 2. Market volume for select segments viz. freight transport, CEP (courier, express, and parcel) and warehousing & storage 3. Forecasts up to 2030 and analysis of growth prospects)
- 5.1 End User Industry
- 5.1.1 Agriculture, Fishing, and Forestry
- 5.1.2 Construction
- 5.1.3 Manufacturing
- 5.1.4 Oil and Gas, Mining and Quarrying
- 5.1.5 Wholesale and Retail Trade
- 5.1.6 Others
- 5.2 Logistics Function
- 5.2.1 Courier, Express, and Parcel (CEP)
- 5.2.1.1 By Destination Type
- 5.2.1.1.1 Domestic
- 5.2.1.1.2 International
- 5.2.2 Freight Forwarding
- 5.2.2.1 By Mode Of Transport
- 5.2.2.1.1 Air
- 5.2.2.1.2 Sea and Inland Waterways
- 5.2.2.1.3 Others
- 5.2.3 Freight Transport
- 5.2.3.1 By Mode Of Transport
- 5.2.3.1.1 Air
- 5.2.3.1.2 Pipelines
- 5.2.3.1.3 Rail
- 5.2.3.1.4 Road
- 5.2.3.1.5 Sea and Inland Waterways
- 5.2.4 Warehousing and Storage
- 5.2.4.1 By Temperature Control
- 5.2.4.1.1 Non-Temperature Controlled
- 5.2.4.1.2 Temperature Controlled
- 5.2.5 Other Services
- 5.2.1 Courier, Express, and Parcel (CEP)
- 5.3 Country
- 5.3.1 Australia
- 5.3.2 China
- 5.3.3 India
- 5.3.4 Indonesia
- 5.3.5 Japan
- 5.3.6 Malaysia
- 5.3.7 Thailand
- 5.3.8 Vietnam
- 5.3.9 Rest of Asia Pacific
6 COMPETITIVE LANDSCAPE
- 6.1 Key Strategic Moves
- 6.2 Market Share Analysis
- 6.3 Company Landscape
- 6.4 Company Profiles (includes Global Level Overview, Market Level Overview, Core Business Segments, Financials, Headcount, Key Information, Market Rank, Market Share, Products and Services, and Analysis of Recent Developments).
- 6.4.1 Alps Logistics
- 6.4.2 C.H. Robinson
- 6.4.3 Deutsche Bahn AG (including DB Schenker)
- 6.4.4 DHL Group
- 6.4.5 DP World
- 6.4.6 DSV A/S (De Sammensluttede Vognmaend af Air and Sea)
- 6.4.7 Expeditors International of Washington, Inc.
- 6.4.8 FedEx
- 6.4.9 Kuehne+Nagel
- 6.4.10 NYK (Nippon Yusen Kaisha) Line
- 6.4.11 SF Express (KEX-SF)
- 6.4.12 SG Holdings Co., Ltd.
- 6.4.13 SINOTRANS
- 6.4.14 United Parcel Service of America, Inc. (UPS)
7 KEY STRATEGIC QUESTIONS FOR FREIGHT AND LOGISTICS CEOS
8 APPENDIX
- 8.1 Global Overview
- 8.1.1 Overview
- 8.1.2 Porter's Five Forces Framework
- 8.1.3 Global Value Chain Analysis
- 8.1.4 Market Dynamics (Market Drivers, Restraints & Opportunities)
- 8.1.5 Technological Advancements
- 8.2 Sources & References
- 8.3 List of Tables & Figures
- 8.4 Primary Insights
- 8.5 Data Pack
- 8.6 Glossary of Terms
- 8.7 Currency Exchange Rate
02-2729-4219
+886-2-2729-4219
 中國貨運與物流-市場佔有率分析、產業趨勢與統計、成長預測(2025-2030)北美貨運和物流:市場佔有率分析、行業趨勢和成長預測(2025-2030 年)南美貨運和物流:市場佔有率分析、行業趨勢和成長預測(2025-2030 年)印尼貨運與物流:市場佔有率分析、產業趨勢與統計、成長預測(2025-2030 年)印度貨運和物流:市場佔有率分析、行業趨勢和統計數據、成長預測(2025-2030 年)德國貨運與物流:市場佔有率分析、產業趨勢與統計、成長預測(2025-2030 年)日本的貨運和物流:市場佔有率分析、行業趨勢和統計、成長預測(2025-2030 年)歐洲貨運和物流-市場佔有率分析、行業趨勢和統計、成長預測(2025-2030 年)法國貨運與物流:市場佔有率分析、產業趨勢與統計、成長預測(2025-2030 年)泰國貨運與物流:市場佔有率分析、產業趨勢與統計、成長預測(2025-2030 年)
▼